Created by

Vekta
Last updated
Categories
Race
Built tool
Made for
Coaches
Athletes
Runs
On demand
Topics
Power profiling
Race pacing
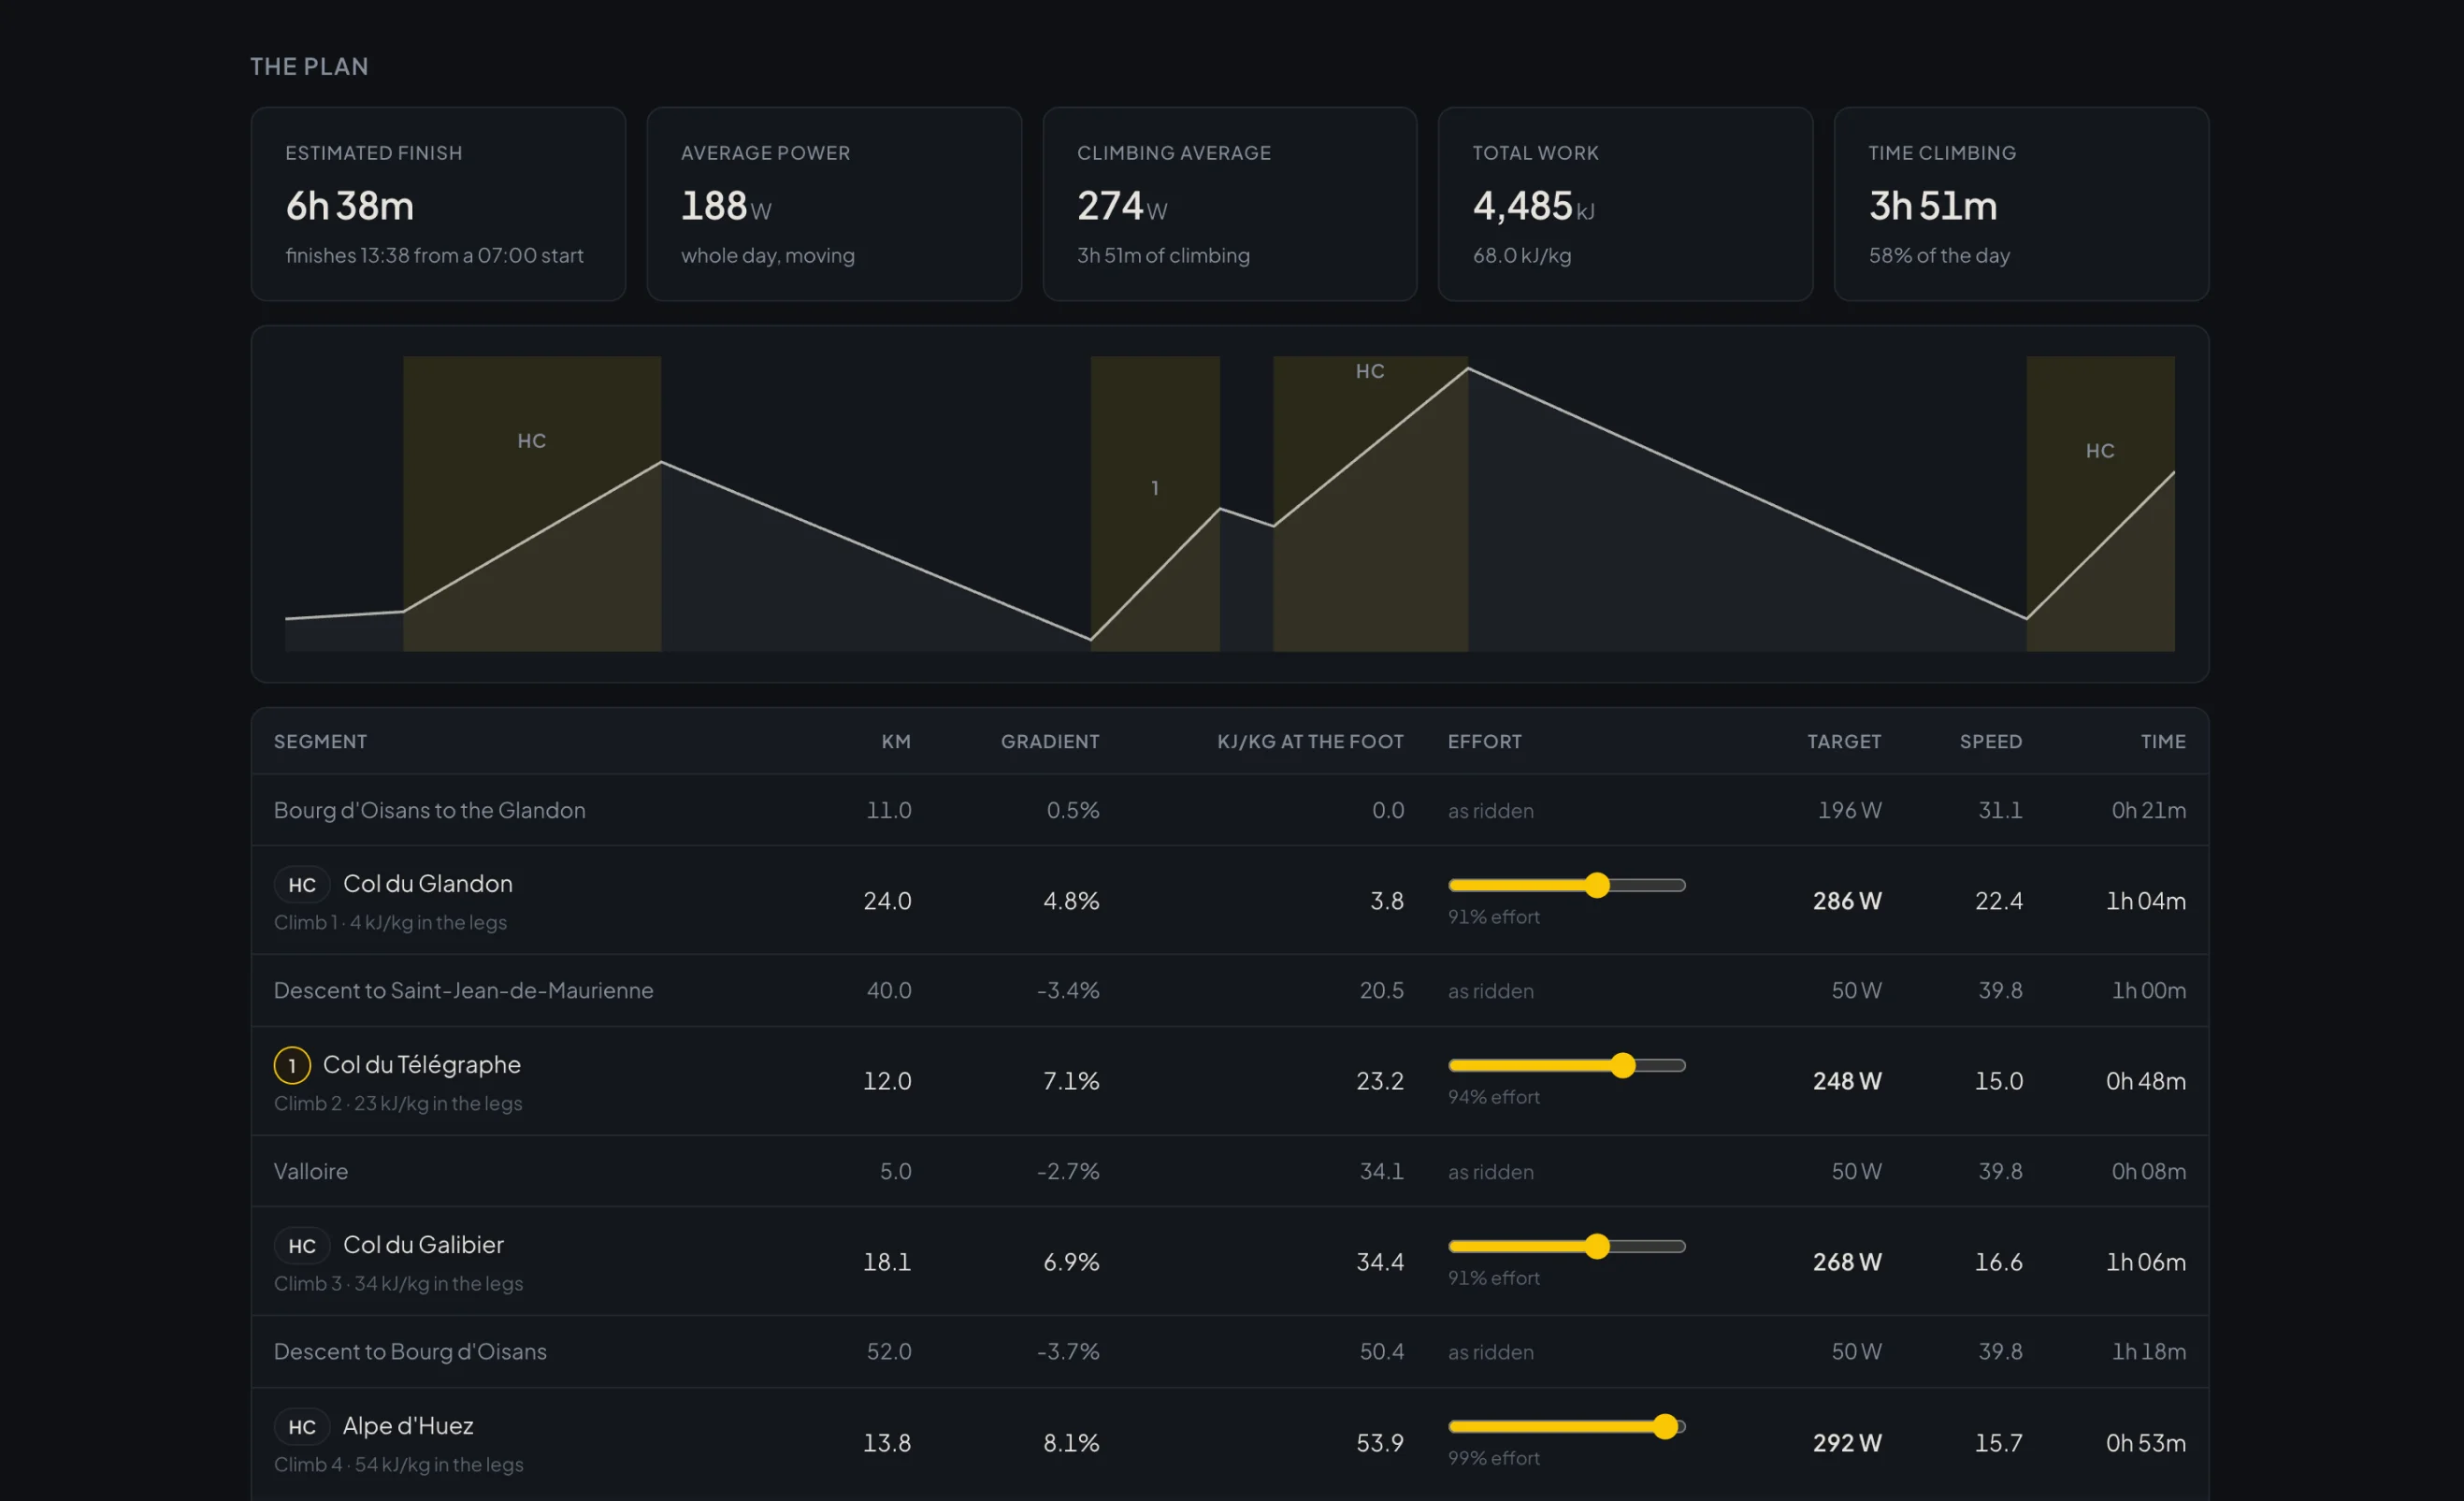
It takes the course of a planned event and the athlete's recorded laps and climbs, each with the work done before it, and sets them against CP, W′ and weight. Every target on the plan is a power the athlete has produced at that point of fatigue.
Two sliders change the plan: effort and weight. The page recomputes every target as they move. It is a plan built from evidence, and the pacing decision stays with the athlete and coach.
How to run it
1
Paste the prompt
Open Claude Code, Codex or Gemini CLI and paste it. Fill in anything in square brackets.
2
Or install the file
Unzip it into ~/.claude/skills for Claude Code, or ~/.agents/skills for Codex and Gemini CLI. Then run it as a Skill by name each time.
3
Let it run
A scheduled skill runs on your own computer, so it has to be on. Everything it reads is your data, through your key.
What it touches
Reads from Vekta
Laps and climbs with the work before them, CP, W′, weight, sleep, the planned event
Writes to Vekta
Nothing. It only reads.
Works in
Claude Code, Codex, Gemini CLI
GET THIS SKILL
The prompt, and the file.
Unlocked on this browser for a year. Paste the prompt into Claude Code, Codex or Gemini CLI, or install the file and run it by name.
THE PROMPT AND FILE
Race Day Simulator Build a race plan for [race] on [date]. If the race or the date is missing, ask for both before doing anything else. Who it is for, and what it produces An athlete on Vekta, or a coach running it for one athlete at a time. The result is one interactive HTML page: a single file, no build step, opened in a browser. Every power target on the plan is an effort the athlete has already recorded, read from the Vekta API. You are the analyst. Report what the record shows. Do not advise, prescribe or coach. Inputs - [race]: the event name. [date]: the day it is ridden. - The athlete. An athlete's own key uses the userId `me`. A coach's key lists the athletes it coaches at GET /users (id, firstName, lastName). Ask which athlete, then use that id in every call below. - The Vekta API key. Read it from the environment variable VEKTA_API_KEY and send it as `Authorization: Bearer <key>`. If it is not set, ask for it. Never print it, never log it, never write it into the page. - Base URL https://api.joinvekta.com. Every list endpoint returns a JSON array. Date filters are `from` and `to`, inclusive, YYYY-MM-DD. There is no pagination. What to read, and over what window The window is the eight weeks (56 days) ending today, the day the plan is prepared. Pull the data with a script, compute everything below, and bake the results into the page as constants. The page never calls the API and never contains the key. 1. GET /users/{userId}/activities?from=<today minus 56 days>&to=<today>. Per activity: startedAtLocal, sport, trainingStimulus, work (kJ), volume (Vekta's training load score), intensity (0 to 100), effectiveDuration (s), and the arrays laps[] and climbs[]. Each lap and each climb carries duration (s), averagePower (W) and workBefore (kJ of work done in the ride before it). Laps and climbs are only populated for cycling. Keep cycling activities only. 2. GET /users/{userId}/metrics over the same window. Rows are dated, one per type: critical power (W), w prime, weight (kg), max power (W), vo2max. Take the latest row of each type; for critical power, w prime and max power take sport cycling. W′ arrives in J or kJ, per the row's unit; show it in kJ. 3. GET /users/{userId}/sleeps over the same window. Per night: day, averageHrv (ms), restingHeartRate (bpm), totalDuration, inBedDuration, deepDuration, remDuration (all seconds). 4. GET /users/{userId}/events?from=<today>&to=[date], to confirm the planned event: name, date, time (local start, HH:MM:SS), distance, elevationGain. (Assumed: the event is used for the start clock only. If no event is planned or time is null, start at 07:00.) 5. GET /users/{userId} for firstName and lastName. Show the athlete as first initial and surname. Streams are not needed. Do not call /activities/{id}/streams. CP and W′ are shown for context. No target is derived from them. The course Vekta does not hold the route. Take it from the published route of [race] and enter it as an ordered list of segments: name, type (flat, climb or descent), length in km, average gradient in %, start altitude and end altitude in m, and for climbs the category (HC, 1, 2, 3 or 4). Keep to the segments a rider would name: the approach, each categorised climb, each descent or valley between them. Total ascent is the sum of the positive altitude gains across the segments. The footer credits it as "Course from the published [race] route." The effort grid, where every target comes from Pool every lap and every climb in the window that has both averagePower and workBefore. Keep efforts of 30 s and longer (assumed from the first row's label). Give each one: - an effort length row: 30s-2m, 2-5m, 5-10m, 10-20m, 20-40m, 40m+. In seconds, lower bound inclusive, upper exclusive: 30 to 120, 120 to 300, 300 to 600, 600 to 1200, 1200 to 2400, 2400 and over. - a fatigue column from workBefore divided by the athlete's weight, in kJ/kg: under 15, 15-30, over 30. Below 15 is the first column, 15 up to but not including 30 the second, 30 and over the third. (Assumed: the weight is the latest weight metric.) That is eighteen cells. A cell's value is the mean of its three highest averagePower efforts, in whole watts, with n = the number of efforts in the cell. A cell with one or two efforts shows the mean of what is there, and its n. An empty cell shows "no record". Reading a cell for a climb (the lookup) Fatigue column: the work done from the start of the day to the foot of the climb, in kJ, divided by the rider weight slider. Effort length row: the climb's own predicted duration. Preference order: 1. the cell for that row and column, if it has n of 3 or more; 2. otherwise the nearest shorter row in the same column with n of 3 or more; 3. otherwise the cell itself, if it has any effort at all; 4. otherwise the nearest shorter row in the same column with any effort; 5. otherwise no target: the climb cannot be planned. Never step to a longer row or to a different column. The page shows no flag when a fallback is used. Speed from power Solve speed v (m/s) by bisection between 0.3 and 35 m/s, 80 iterations: the largest v such that m·g·sin θ·v + Crr·m·g·cos θ·v + 0.5·ρ·CdA·v³ < P × 0.976 with θ = atan(gradient/100), g = 9.81, Crr = 0.005, CdA = 0.32 on climbs, m = rider weight + bike and kit (both sliders), ρ = 1.225·exp(−altitude/8435) at the segment's mid altitude, (start + end)/2. 0.976 is drivetrain efficiency. The plan, segment by segment, in course order Keep a running total of work in kJ (cum) and of seconds (total). Both start at zero. Climb: effort% is that climb's slider (75 to 100). Start from a guess of 1,800 s. Repeat up to 40 times: look up the cell for (row of the guess, column of cum ÷ rider weight); P = cell watts × effort%; solve v; new duration = km × 1000 ÷ v; if it is within 1 s of the guess, stop; otherwise set the guess to the mean of the two and repeat. Then look up once more with the settled duration. Target P = round(cell watts × effort%). Solve v from P. Duration = km × 1000 ÷ v. Record P, v, the duration, and the source line "Climb N · X kJ/kg in the legs", X = cum ÷ rider weight, 0 dp. Flat and descent: "as ridden". Use the athlete's own recorded mean speed and mean power for flat riding and for descending: one pair for every flat segment, one pair for every descent, each with the count of recorded segments it came from. (Assumed: taken from the same window's laps, classed flat or descending by elevationGain and elevationLoss against distance. State the cut you used in the footer.) Speed is the recorded speed, P the recorded power, duration = km × 1000 ÷ v. After every segment: kJ/kg at the foot = cum ÷ rider weight, taken before the segment is added; then cum += P × duration ÷ 1000, total += duration. Totals - Estimated finish = total, as "Xh XXm". Sub-line: "finishes HH:MM from a HH:MM start". - Average power = cum × 1000 ÷ total, whole watts. Sub-line: "whole day, moving". - Climbing average = Σ(P × duration) ÷ Σ duration over the climbs, whole watts. Sub-line: "Xh XXm of climbing". - Total work = cum, whole kJ with a thousands separator. Sub-line: cum ÷ rider weight, 1 dp, "kJ/kg". - Time climbing = Σ climb durations, "Xh XXm". Sub-line: round(climb time ÷ total × 100), "% of the day". - Table footer: Total | total km, whole | blank | cum ÷ rider weight, 1 dp, "kJ/kg" | blank | the plain mean of the climb targets, whole watts, "N W avg" | blank | total as "Xh XXm". The sliders - Effort on every climb: 75 to 100, step 1, default 100, readout "100%". Moving it sets every climb's own slider to the same value and recalculates. - Rider weight: 58 to 85 kg, step 0.5, default the athlete's latest weight, readout to 1 dp, "66.0 kg". (Widen the range only if the athlete's weight sits outside it.) It changes the mass in the speed solver and every kJ/kg figure, so a climb can move to a different fatigue column or effort row. It never changes the watts in the grid. - Bike and kit: 6 to 12 kg, step 0.1, default 8.0, readout "8.0 kg". - One slider per climb in the table row: 75 to 100, step 1, caption "N% effort". It changes that climb only. The master readout stays as it was. Every slider recalculates the whole day on input. Easing off one climb lowers cum, so the next climb reads a fresher column, and its target moves. The page, in this order Page title: "[race short name] Race Plan". 1. Header. Eyebrow: "Race plan · prepared [today, as 11 September 2026]". H1: "[Initial. Surname] · [race]". Sub-line: "[km] km, [ascent] m and [N, as a word] categorised climbs." 2. "Condition today · [N] days out", N = days from today to the race. One card with two rows of eight stats, each a label, a value and a change line. Row 1: Load-8; Load-2; Load-2 : Load-8; Strain, 14d; Volume 7d; Days trained, 28; Biggest ride, 28d; Critical power. Row 2: HRV last night; HRV 7-night; HRV 28-night; Resting HR; Sleep 7d; Deep, nightly; REM, nightly; Sleep efficiency. Then chips: VO₂max; W′ (kJ, 1 dp); Max power (W); Weight (kg); 28-day stimulus (counts of trainingStimulus over the last 28 days, most frequent first, as "8 aerobic, 3 threshold, 1 recovery"). Then a short note in plain prose: HRV last night against the 7-night mean and the 28-night baseline, with the nights on record; resting HR against its 28-night mean; days trained of 28; Load-2 against Load-8, and whether the athlete is still building or already tapering with N days to go; the biggest day on record in kJ/kg against the course. State what the record shows. No advice. Definitions. Load-8 and Load-2 are Vekta's load figures: an exponentially weighted moving average of the daily sum of volume (zero on days without a ride), spans 56 and 14 days, alpha 2/57 and 2/15, seeded from zero 56 days before today, the window start. Strain is the same average, span 14, of the daily duration-weighted mean intensity. These are the app's method; the API returns volume and intensity per session, not the averages. Load-2 : Load-8 is the ratio, 2 dp, with "×". Volume 7d: the sum of volume over the last 7 days, whole. Days trained, 28: distinct local days with an activity, as "26/28". Biggest ride, 28d: the largest activity work ÷ weight, 1 dp, kJ/kg. Critical power: the latest CP, whole watts, no change line. HRV: averageHrv last night, the 7-night mean, the 28-night mean, whole ms. Resting HR: last night's restingHeartRate, whole bpm. Sleep 7d: mean totalDuration over 7 nights, hours, 1 dp. Deep and REM: mean nightly minutes over 7 nights, whole (assumed). Sleep efficiency: totalDuration ÷ inBedDuration, whole % (assumed). Change lines: ▲, ▼ or ▬, then the whole-% change against the same figure one period earlier (assumed: a 7-day figure against the 7 days before it, a 28-day figure against the 28 before, a point value against seven days earlier). Colour: the load row is always neutral; HRV and sleep up is green, down is red; resting HR down is green, up is red; 0% is neutral with ▬. The HRV last night value is green when above the 28-night baseline (assumed). 3. "The plan". Five KPI cards in a row: Estimated finish; Average power; Climbing average; Total work; Time climbing. Below them, in a card, the elevation profile: an SVG 960 by 150, x = cumulative distance, y = altitude with the highest point near the top and the lowest near the bottom, the profile as a line in the text colour at 75% opacity, the area under it filled at 4.5%, each climb's span shaded in the accent yellow at 10% opacity with its category centred above the summit in small muted capitals. Below that the segment table: Segment | km | Gradient | kJ/kg at the foot | Effort | Target | Speed | Time. A climb row: the category chip, the name, the source line under it in small faint text, the effort slider with its caption, the target in bold as "314 W". Flat and descent rows are muted, "as ridden" in the effort column, the power not bold. Then the footer row. 4. "Adjust". The three sliders side by side, label above, readout right-aligned. Under them: "Every target is a number [the athlete] has already produced, at that length of effort, with that much work already in the legs. Ease off on one climb and the whole day recalculates: [the athlete reaches] the next col fresher, and the target moves with [them]." 5. "Where every target came from". The grid as a table: Effort length | Under 15 kJ/kg | 15-30 kJ/kg | Over 30 kJ/kg, six rows, each cell "314 W" with the watts in bold and "n=22" in small faint text under it, or "no record" in faint text. Under the table a note: "The mean of [the athlete's] three best efforts at each length and each level of accumulated work, from [N] recorded laps and climbs in the eight weeks to [today]. Taking three rather than one keeps a single freak effort from setting the target; where fewer than three exist, the cell says so. Vekta segments the efforts and stamps every one with workBefore; the only step taken here is sorting them into these eighteen cells and reading the right one for each climb." 6. Footer: "Read from /users/{id}/activities (laps, climbs and workBefore), /users/{id}/metrics and /users/{id}/sleeps, [window start] to [window end]. Course from the published [race] route. Target power is recorded, never modelled; speed is solved from that power against gravity, rolling resistance and air density at altitude." Formats and units Dates as "11 September 2026". Clock times 24-hour, "07:00". Durations "Xh XXm", minutes zero-padded. Distance: km to 1 dp in the table, whole in the header and the footer row. Gradient: 1 dp with "%". kJ/kg: 1 dp, except the climb source line, 0 dp. Power: whole watts, "W". Speed: km/h, 1 dp. Work: whole kJ with a thousands separator. Percentages: whole. The ratio: 2 dp with "×". Weight: 1 dp on the sliders, whole on the chip. A unit follows a space, in a smaller muted size, except "%". Design One self-contained HTML file. Plus Jakarta Sans from Google Fonts (400, 500, 600, 700). Body 14 px, line height 1.55, max width 1,180 px, page padding 32 px 20 px 72 px, antialiased. Cards: surface background, 1 px border, 10 px radius, 18 px 20 px padding. H1 26 px, weight 600. Section titles 14 px, uppercase, letter-spacing 0.06 em, muted, weight 600, 38 px above and 14 px below. KPI labels 11 px uppercase muted; KPI values 23 px, weight 600, tabular numerals, with the unit at 13 px muted; KPI sub-lines 12 px muted. The stat grid: 1 px gaps on the border colour, 8 px radius, stat labels 10.5 px uppercase muted, values 17 px weight 600, change lines 11 px weight 600. Notes: surface-2 background, 1 px border, 8 px radius, 13 px muted text. Table headers 11 px uppercase, letter-spacing 0.05 em, muted, on surface-2; cells 11 px 13 px padding, 1 px rules; numeric columns right-aligned with tabular numerals; non-climb rows muted at 13 px. Sliders take the accent yellow. Category chips: pills, 11 px, weight 600; "HC" plain, any other category with a yellow border on the amber background. Slider captions and source lines 11 px faint. Tokens, light: bg #F2F0EB, surface #FFFFFF, surface-2 #FAF9F6, border #E4E1D9, text #16191d, muted #6C7681, faint #A2A9B2, yellow #FBCE01, red #B23A2E, amber #8A5A06, amber-bg #FCF6E8, green #1C7346, green-bg #EDF4F0. Tokens, dark, under prefers-color-scheme: dark and whenever the root carries data-theme="dark": bg #0B0E13, surface #13171E, surface-2 #171C24, border #252C36, text #E9E7E1, muted #8F99A5, faint #646E7A, red #E88C7E, amber #D3A462, amber-bg #221B10, green #63BC92, green-bg #14241D. Yellow stays #FBCE01. Responsive: five KPI columns, three under 1,000 px, two under 760 px; the stat grid four columns, two under 760 px; the table card scrolls sideways on a phone. Rate limits 300 requests a minute per key, 30 a minute per athlete. This plan needs five or six requests. Streams count against the key only, and are not used here. A 429 carries Retry-After: wait that long and retry. This is a plan built from the athlete's own recorded efforts. It shows what has already been done at each level of fatigue, nothing more. Decisions on the day stay with the athlete and the coach. Docs: api.joinvekta.com/openapi.json
Planning
Race training plan
A periodised plan for your target race, built from the course's demands and your power profile, and fitted to the hours you actually train.
Reports
Training Response Report
A progress report for every athlete you coach, over 7, 30 or 60 days, written for them: the verdict, the numbers and how the body responded.
Reports
Weekly training review
An automatic weekly review of your training against the month before, and shows what it means for next week.