
Coach
Coach
Coach
9
9
9
min
min
min
George Evans
George Evans
Building W′ at the Cost of Critical Power
Building W′ at the Cost of Critical Power
Coach George Evans on how he rebuilt Killian O'Brien's season around a single weakness.
Key Takeaways
Killian O'Brien's Critical Power was never the problem. His races were being decided by repeated surges, and his W′ and short-duration power couldn't answer them.
His coach, George Evans, built the season around that weakness and accepted that the headline number would fall. Modelled Critical Power dipped through the first half of the season, while W′ nearly doubled over the year, from 12.5 kJ to 24.4 kJ.
The proof came late in races. After 40 kJ/kg of work, Killian still holds 94% of his Critical Power. That fatigued profile is the kind George's PhD research suggests tells you more than fresh numbers.
By August, he was spending 99 km in the break at the Philadelphia Cycling Classic, and winning its sprints classification in a field with five WorldTour teams.
George Evans is a cycling coach and co-founder of BE Performance, working with riders from junior to professional level. He is also a PhD researcher at the University of Hertfordshire, investigating endurance performance and durability. Here he explains how he rebuilt the season of Killian O'Brien, a 20-year-old Irish climber with UCI Continental team Team Skyline, around a weakness his headline number couldn't show. Killian's data is shared with his permission and drawn from the Vekta API. What follows is in George's words.
On 30 August, eleven kilometres into the Philadelphia Cycling Classic, Killian led the race over the Manayunk Wall. A lap later, he led it over again. He spent 99 kilometres off the front of a field that included five WorldTour teams, and left Philadelphia with the intermediate sprints classification and second place in the mountains competition.
A year earlier, through much of his first season as an under-23, he had been "just hanging on," as he put it.
The change did not come from chasing his Critical Power. For the first half of this season, the number most training is built around actually fell, and we expected it to. The work was aimed somewhere else entirely.
The Problem Was Never His Critical Power
Killian started working with me in December, and the limiter revealed itself from two directions. The first was Killian himself: he could tell me exactly where he was being gapped and where he was burning matches. The second was his data, which confirmed it.
Two numbers frame what we found. Critical Power (CP) marks the boundary between the heavy and severe intensity domains, and is the gold standard for defining the maximal metabolic steady state (Jones et al., 2019). W′ is the finite amount of work a rider can do above it before being forced to back off.
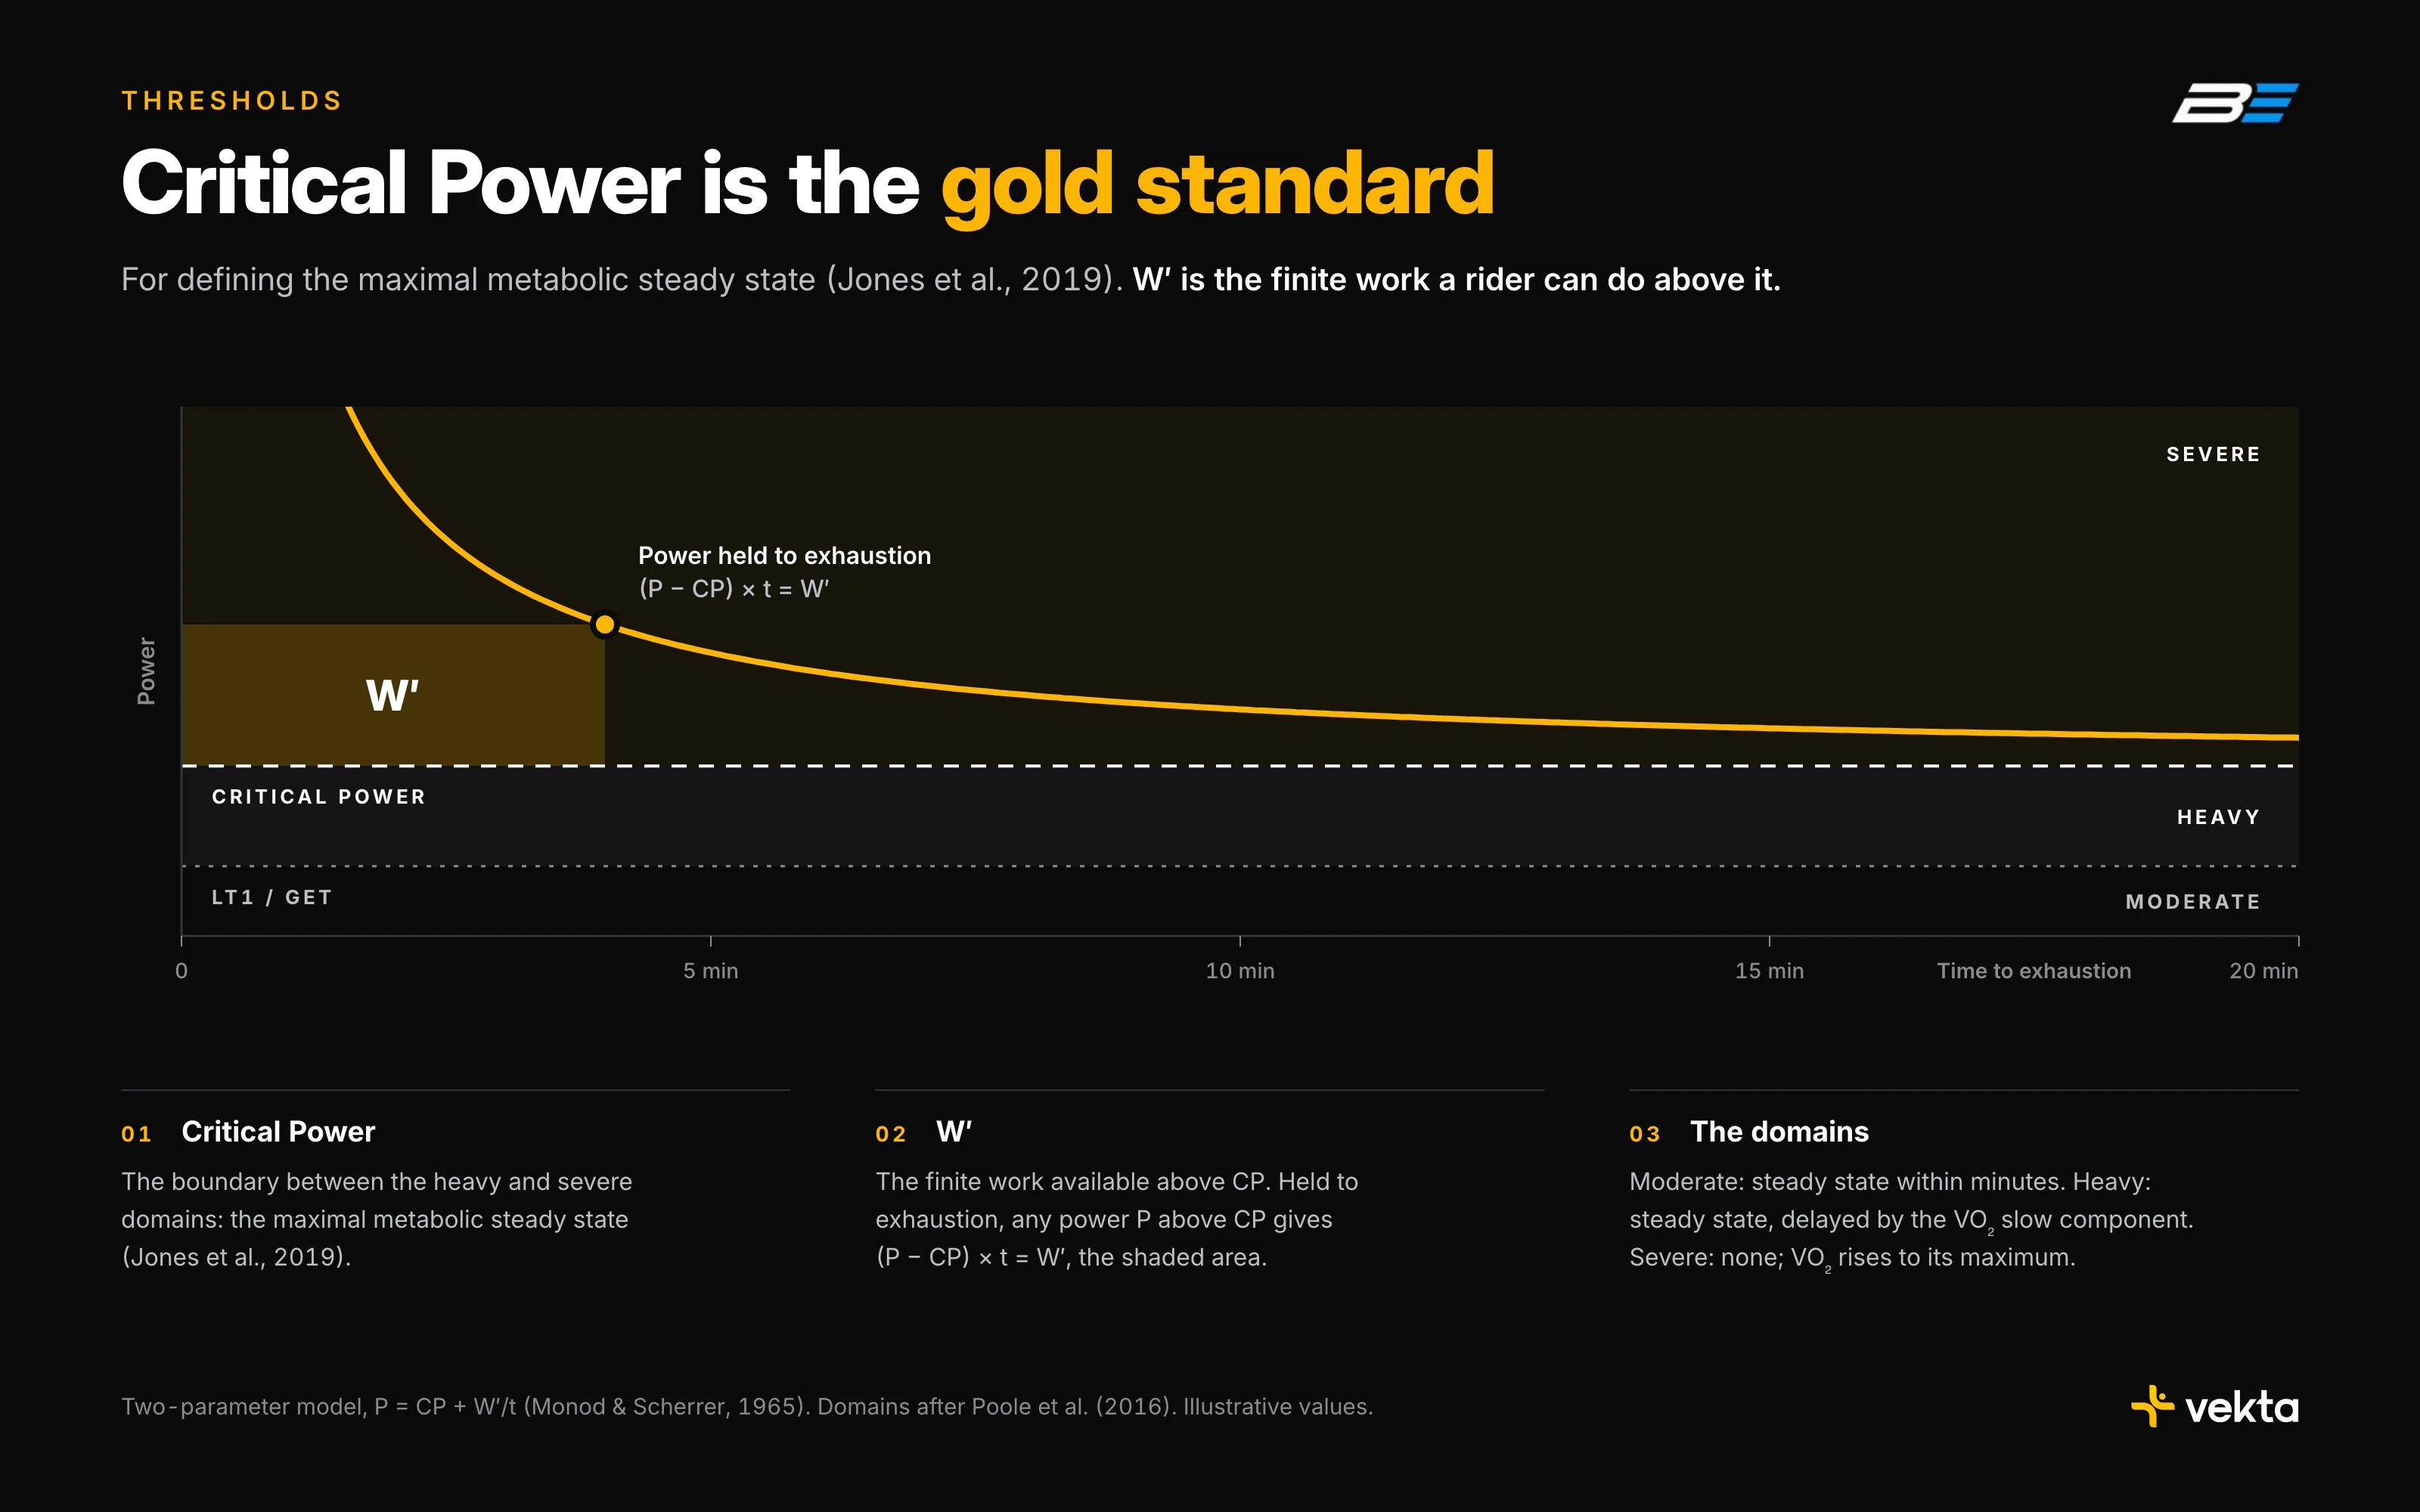
Killian's CP was already competitive for the level he was racing. His W′, and his power from a maximal sprint out to around two minutes, were low by comparison. His races were being decided by short, repeated surges, and that was precisely where he was fading. Closing a gap was a near-maximal effort for him, and each one carried a cost he paid later in the race. The long, steady phases were never the problem.
Punch was his biggest weakness, so punch became the focus. The principle was simple: fix the limiter without neglecting the rest.
The Number That Had to Go Down
Through the first half of the year, Killian's modelled CP fell while his W′ climbed.

We expected this, and part of it was almost certainly a modelling artefact. CP is estimated from the power-duration curve. When most of a rider's hard efforts are short, and the new bests all sit at those durations, the curve changes shape. Without many maximal long efforts to anchor it, the model reads a higher W′ and a lower CP, even when aerobic fitness hasn't really dropped.
Fewer long maximal efforts, not lost fitness.
We discussed it before it happened. Killian was naturally keen to prove himself over longer efforts, but he committed to building his maximal power through short efforts, micro-intervals and high-torque work. His strengths were never abandoned. Longer work stayed in the programme, in the background, to maintain them.
Training the Surge
Longer, traditional VO2max intervals still have a place, and we still used them. But micro-interval formats such as 40/20s and 30/15s allow precise control of work-rest ratios and intensities, and therefore of the stimulus a session delivers.
With Killian, the target was often a VO2max stimulus. Micro-intervals held him at a high fraction of VO2max while pushing each "on" period above the power he could sustain in longer efforts. That accustomed him to producing higher powers, added peripheral stimulus, and trained his capacity to absorb repeated surges, which is much closer to how his races actually unfold.
One of the sessions we relied on was pre-loaded 30/15s. A CP effort immediately before each block raises oxygen uptake, so the 30/15s begin with physiological responses already elevated, and more of the session is spent above roughly 90% of VO2max, a major driver of adaptation. Distribute several blocks across a longer ride and the session trains durability as well: the ability to repeat high-intensity work as fatigue accumulates.
Then the Racing Changed
Race-specific work never leaves my programmes entirely. Its frequency and intensity shift through the year, but it is worth maintaining even in winter, and in Killian's early phase it overlapped with the work on his weakness. Pre-loaded micro-intervals, bursts from threshold and fast-start intervals built his tolerance for surges while keeping the training close to the demands of racing.
By June, we both felt he had made significant gains in maximal power and in handling surges, and the data supported that. His calendar was also filling with races that rewarded different parts of his profile.
The Green Mountain Stage Race and Il Lombardia U23 carried a lot of climbing, including longer climbs, where his CP and durability would be genuine assets. The Philadelphia Cycling Classic, many of the Italian races and the Irish national championships were built on repeated short, steep climbs. There, the high-intensity, repeatable side of durability would decide whether his punch was still there late in the race.
So the balance shifted. We added slightly more work around his strengths and built repeated race-specific efforts into longer rides, so that both his new punch and his CP would be available at the end of a race, where it counts.
The results were already arriving. Third on stage 2 of the Tour de Beauce, and second in the young rider classification. A first senior road race win, at the Meath Grand Prix. Ninth in the elite road race at the Irish National Championships. Then Philadelphia, and days later, sixth in the Green Mountain prologue.
Where Races Are Actually Decided
The first major study of my PhD tested 15 competitive cyclists with an average VO2max above 60 ml/kg/min. It found that more physiological markers were related to performance, in both time trials and road races, when they were measured fatigued rather than fresh. Partial findings were presented at Science & Cycling 2025, and I hope to publish the full study next year.
Fresh numbers still matter. But how a rider's physiology looks under fatigue, and how it changes, reveals where their real strengths lie and where performance can still be found. Day to day, I want to know how a rider's whole power profile holds up after a set amount of work, not just where their fresh bests sit, because that is when races tend to be decided.
Over the past 365 days, Killian's profile has changed as follows:
Critical Power: 362 W (6.1 W/kg), up 5.2%
W′: 24.4 kJ, up from 12.5 kJ
Peak power: 960 W (16.3 W/kg), up 14.1%
Durability: CP of 341 W after 40 kJ/kg of work, 94% held
Compound score (5-min W × W/kg): 3,620, up from 2,830 (+28%)
I measure Killian's durability after 40 kJ/kg because that load best reflects the races he rides and where they are generally decided. After it, his 1-minute power falls by 16%, his 5-minute power by 12% and his 20-minute power by 5%. The same rider produces different numbers late in a race, and those are the numbers that matter.

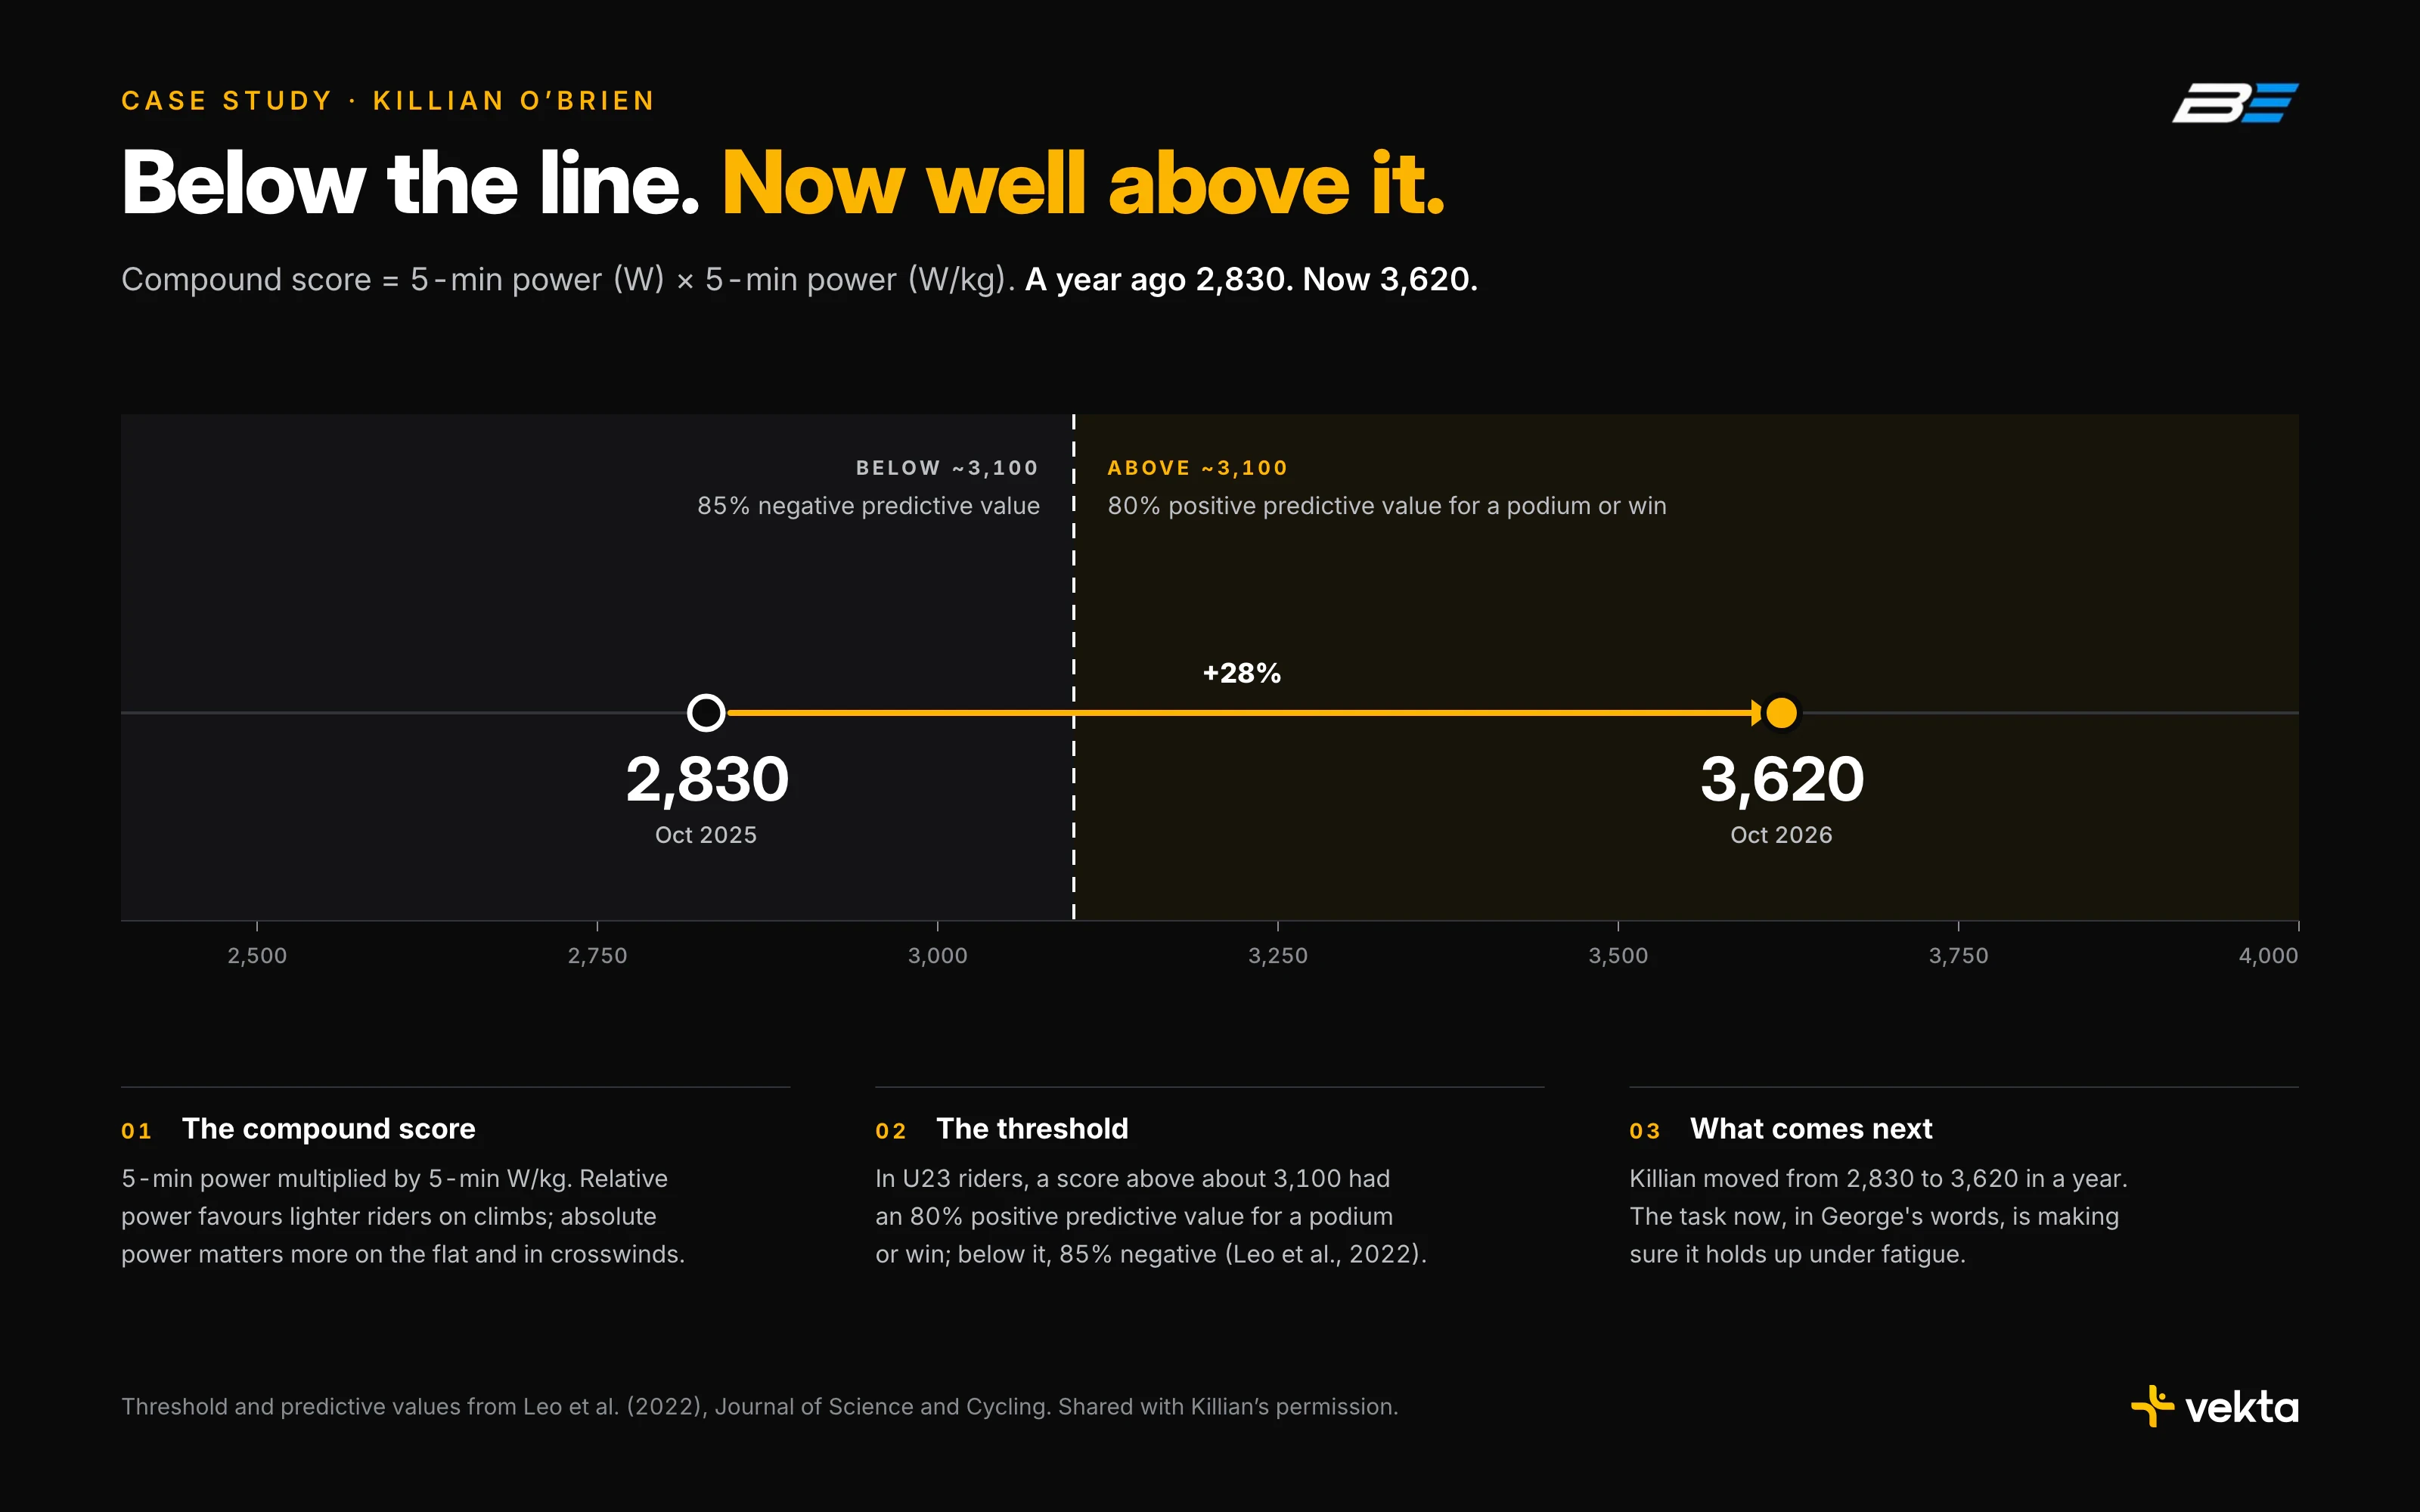
Power is usually expressed as absolute (watts) or relative (W/kg), and each rewards something different: relative power favours lighter riders on climbs, while absolute power matters more on the flat and in crosswinds. The compound score multiplies 5-minute power by 5-minute W/kg to capture both. In a study of U23 riders, a score above about 3,100 had an 80% positive predictive capacity for a podium or win, and a score below it an 85% negative predictive capacity (Leo et al., 2022). When we started working together, Killian sat below that line. He now sits well above it, which is a very good sign for next year. The task now is making sure it holds up under fatigue.
How to Find Your Own Limiter
Begin where Killian's season began: with what the rider says about where they are losing races, checked against what the data shows.
How you then test depends on how much of the power-duration curve a rider reaches maximally in training and racing. Killian races often, so race and training files gave us reliable CP and W′ estimates. We used targeted tests to fill gaps in the curve, or to probe areas where I believed he was capable of more than it showed, both fresh and fatigued. A rider who rarely produces maximal efforts across the curve is usually better served by a test or two.
Laboratory testing is valuable, but it depends on access and it is not essential. We have not done any with Killian this year. For prescribing training, testing on the rider's own equipment, in familiar conditions, is normally better. A lab-derived LT1 can complement field-based CP for some specific prescription. Where the lab really earns its place is in showing what training is doing to physiology: changes in VO2max, thresholds and efficiency.
Durability deserves the same care. It depends on what you measure, how much work has been done and how that work was accumulated, so no single number captures it. Measure something relevant to your own racing, after an equivalent load. If your races are often decided by 5-minute efforts, track your 5-minute power after the work you would typically have done by that point in a race.
Whatever method you choose, keep the protocol and conditions identical every time. Otherwise you are measuring noise, not change.
Next Year Starts With Durability
Durability will be a focus for next season. Killian now has a very strong power profile, and the task is to make sure it holds late in races while continuing to raise it. Alongside that, we'll keep building his force and maximal power, with focused gym work to complement the on-bike training, especially through the winter, which may also help his durability.
Improving one area of a rider's physiology is relatively straightforward. When a rider improves across the board, as Killian has this year, you know they are becoming a different rider. If we can produce similar gains again, I see no reason the trajectory should stop.
We have not yet been working together for a full year, and the difference is night and day.
The Data Behind Every Decision
Every number in Killian's profile comes from Vekta. CP and W′ are modelled from every training and race file, so the power-duration curve evolves with the rider rather than waiting for a test day.
Durability sits within the Peaks tab. It compares a rider's peak powers after 0 to 50 kJ/kg of work, in 10 kJ/kg steps, so a coach can see at a glance how the full profile holds up under fatigue. For deeper analysis, the Vekta API opens the same data to a coach's own tools. George uses it to run his own CP calculations from filtered MMP data, and to analyse filtered CP and W′ across different fatigue loads.

Built for the Part of the Race That Decides It
The modelling George uses with Killian is available to every coach and athlete on Vekta. Start a 14-day free trial, or book a demo to see it applied to your own riders.
Start your free trial → Book a demo →
References
Jones, A. M., Burnley, M., Black, M. I., Poole, D. C., & Vanhatalo, A. (2019). The maximal metabolic steady state: redefining the ‘gold standard’. Physiological Reports, 7(10), e14098.
Leo, P., Spragg, J., Wakefield, J., & Swart, J. (2022). The Compound Score in elite road cycling. Journal of Science and Cycling, 11(2).
Key Takeaways
Killian O'Brien's Critical Power was never the problem. His races were being decided by repeated surges, and his W′ and short-duration power couldn't answer them.
His coach, George Evans, built the season around that weakness and accepted that the headline number would fall. Modelled Critical Power dipped through the first half of the season, while W′ nearly doubled over the year, from 12.5 kJ to 24.4 kJ.
The proof came late in races. After 40 kJ/kg of work, Killian still holds 94% of his Critical Power. That fatigued profile is the kind George's PhD research suggests tells you more than fresh numbers.
By August, he was spending 99 km in the break at the Philadelphia Cycling Classic, and winning its sprints classification in a field with five WorldTour teams.
George Evans is a cycling coach and co-founder of BE Performance, working with riders from junior to professional level. He is also a PhD researcher at the University of Hertfordshire, investigating endurance performance and durability. Here he explains how he rebuilt the season of Killian O'Brien, a 20-year-old Irish climber with UCI Continental team Team Skyline, around a weakness his headline number couldn't show. Killian's data is shared with his permission and drawn from the Vekta API. What follows is in George's words.
On 30 August, eleven kilometres into the Philadelphia Cycling Classic, Killian led the race over the Manayunk Wall. A lap later, he led it over again. He spent 99 kilometres off the front of a field that included five WorldTour teams, and left Philadelphia with the intermediate sprints classification and second place in the mountains competition.
A year earlier, through much of his first season as an under-23, he had been "just hanging on," as he put it.
The change did not come from chasing his Critical Power. For the first half of this season, the number most training is built around actually fell, and we expected it to. The work was aimed somewhere else entirely.
The Problem Was Never His Critical Power
Killian started working with me in December, and the limiter revealed itself from two directions. The first was Killian himself: he could tell me exactly where he was being gapped and where he was burning matches. The second was his data, which confirmed it.
Two numbers frame what we found. Critical Power (CP) marks the boundary between the heavy and severe intensity domains, and is the gold standard for defining the maximal metabolic steady state (Jones et al., 2019). W′ is the finite amount of work a rider can do above it before being forced to back off.
Killian's CP was already competitive for the level he was racing. His W′, and his power from a maximal sprint out to around two minutes, were low by comparison. His races were being decided by short, repeated surges, and that was precisely where he was fading. Closing a gap was a near-maximal effort for him, and each one carried a cost he paid later in the race. The long, steady phases were never the problem.
Punch was his biggest weakness, so punch became the focus. The principle was simple: fix the limiter without neglecting the rest.
The Number That Had to Go Down
Through the first half of the year, Killian's modelled CP fell while his W′ climbed.
We expected this, and part of it was almost certainly a modelling artefact. CP is estimated from the power-duration curve. When most of a rider's hard efforts are short, and the new bests all sit at those durations, the curve changes shape. Without many maximal long efforts to anchor it, the model reads a higher W′ and a lower CP, even when aerobic fitness hasn't really dropped.
Fewer long maximal efforts, not lost fitness.
We discussed it before it happened. Killian was naturally keen to prove himself over longer efforts, but he committed to building his maximal power through short efforts, micro-intervals and high-torque work. His strengths were never abandoned. Longer work stayed in the programme, in the background, to maintain them.
Training the Surge
Longer, traditional VO2max intervals still have a place, and we still used them. But micro-interval formats such as 40/20s and 30/15s allow precise control of work-rest ratios and intensities, and therefore of the stimulus a session delivers.
With Killian, the target was often a VO2max stimulus. Micro-intervals held him at a high fraction of VO2max while pushing each "on" period above the power he could sustain in longer efforts. That accustomed him to producing higher powers, added peripheral stimulus, and trained his capacity to absorb repeated surges, which is much closer to how his races actually unfold.
One of the sessions we relied on was pre-loaded 30/15s. A CP effort immediately before each block raises oxygen uptake, so the 30/15s begin with physiological responses already elevated, and more of the session is spent above roughly 90% of VO2max, a major driver of adaptation. Distribute several blocks across a longer ride and the session trains durability as well: the ability to repeat high-intensity work as fatigue accumulates.
Then the Racing Changed
Race-specific work never leaves my programmes entirely. Its frequency and intensity shift through the year, but it is worth maintaining even in winter, and in Killian's early phase it overlapped with the work on his weakness. Pre-loaded micro-intervals, bursts from threshold and fast-start intervals built his tolerance for surges while keeping the training close to the demands of racing.
By June, we both felt he had made significant gains in maximal power and in handling surges, and the data supported that. His calendar was also filling with races that rewarded different parts of his profile.
The Green Mountain Stage Race and Il Lombardia U23 carried a lot of climbing, including longer climbs, where his CP and durability would be genuine assets. The Philadelphia Cycling Classic, many of the Italian races and the Irish national championships were built on repeated short, steep climbs. There, the high-intensity, repeatable side of durability would decide whether his punch was still there late in the race.
So the balance shifted. We added slightly more work around his strengths and built repeated race-specific efforts into longer rides, so that both his new punch and his CP would be available at the end of a race, where it counts.
The results were already arriving. Third on stage 2 of the Tour de Beauce, and second in the young rider classification. A first senior road race win, at the Meath Grand Prix. Ninth in the elite road race at the Irish National Championships. Then Philadelphia, and days later, sixth in the Green Mountain prologue.
Where Races Are Actually Decided
The first major study of my PhD tested 15 competitive cyclists with an average VO2max above 60 ml/kg/min. It found that more physiological markers were related to performance, in both time trials and road races, when they were measured fatigued rather than fresh. Partial findings were presented at Science & Cycling 2025, and I hope to publish the full study next year.
Fresh numbers still matter. But how a rider's physiology looks under fatigue, and how it changes, reveals where their real strengths lie and where performance can still be found. Day to day, I want to know how a rider's whole power profile holds up after a set amount of work, not just where their fresh bests sit, because that is when races tend to be decided.
Over the past 365 days, Killian's profile has changed as follows:
Critical Power: 362 W (6.1 W/kg), up 5.2%
W′: 24.4 kJ, up from 12.5 kJ
Peak power: 960 W (16.3 W/kg), up 14.1%
Durability: CP of 341 W after 40 kJ/kg of work, 94% held
Compound score (5-min W × W/kg): 3,620, up from 2,830 (+28%)
I measure Killian's durability after 40 kJ/kg because that load best reflects the races he rides and where they are generally decided. After it, his 1-minute power falls by 16%, his 5-minute power by 12% and his 20-minute power by 5%. The same rider produces different numbers late in a race, and those are the numbers that matter.
Power is usually expressed as absolute (watts) or relative (W/kg), and each rewards something different: relative power favours lighter riders on climbs, while absolute power matters more on the flat and in crosswinds. The compound score multiplies 5-minute power by 5-minute W/kg to capture both. In a study of U23 riders, a score above about 3,100 had an 80% positive predictive capacity for a podium or win, and a score below it an 85% negative predictive capacity (Leo et al., 2022). When we started working together, Killian sat below that line. He now sits well above it, which is a very good sign for next year. The task now is making sure it holds up under fatigue.
How to Find Your Own Limiter
Begin where Killian's season began: with what the rider says about where they are losing races, checked against what the data shows.
How you then test depends on how much of the power-duration curve a rider reaches maximally in training and racing. Killian races often, so race and training files gave us reliable CP and W′ estimates. We used targeted tests to fill gaps in the curve, or to probe areas where I believed he was capable of more than it showed, both fresh and fatigued. A rider who rarely produces maximal efforts across the curve is usually better served by a test or two.
Laboratory testing is valuable, but it depends on access and it is not essential. We have not done any with Killian this year. For prescribing training, testing on the rider's own equipment, in familiar conditions, is normally better. A lab-derived LT1 can complement field-based CP for some specific prescription. Where the lab really earns its place is in showing what training is doing to physiology: changes in VO2max, thresholds and efficiency.
Durability deserves the same care. It depends on what you measure, how much work has been done and how that work was accumulated, so no single number captures it. Measure something relevant to your own racing, after an equivalent load. If your races are often decided by 5-minute efforts, track your 5-minute power after the work you would typically have done by that point in a race.
Whatever method you choose, keep the protocol and conditions identical every time. Otherwise you are measuring noise, not change.
Next Year Starts With Durability
Durability will be a focus for next season. Killian now has a very strong power profile, and the task is to make sure it holds late in races while continuing to raise it. Alongside that, we'll keep building his force and maximal power, with focused gym work to complement the on-bike training, especially through the winter, which may also help his durability.
Improving one area of a rider's physiology is relatively straightforward. When a rider improves across the board, as Killian has this year, you know they are becoming a different rider. If we can produce similar gains again, I see no reason the trajectory should stop.
We have not yet been working together for a full year, and the difference is night and day.
The Data Behind Every Decision
Every number in Killian's profile comes from Vekta. CP and W′ are modelled from every training and race file, so the power-duration curve evolves with the rider rather than waiting for a test day.
Durability sits within the Peaks tab. It compares a rider's peak powers after 0 to 50 kJ/kg of work, in 10 kJ/kg steps, so a coach can see at a glance how the full profile holds up under fatigue. For deeper analysis, the Vekta API opens the same data to a coach's own tools. George uses it to run his own CP calculations from filtered MMP data, and to analyse filtered CP and W′ across different fatigue loads.
Built for the Part of the Race That Decides It
The modelling George uses with Killian is available to every coach and athlete on Vekta. Start a 14-day free trial, or book a demo to see it applied to your own riders.
Start your free trial → Book a demo →
References
Jones, A. M., Burnley, M., Black, M. I., Poole, D. C., & Vanhatalo, A. (2019). The maximal metabolic steady state: redefining the ‘gold standard’. Physiological Reports, 7(10), e14098.
Leo, P., Spragg, J., Wakefield, J., & Swart, J. (2022). The Compound Score in elite road cycling. Journal of Science and Cycling, 11(2).
Try Vekta free
Put the theory to work
Vekta is where coaches and athletes plan the work, see the numbers, and track what actually changes.
Try Vekta free
Put the theory to work
Vekta is where coaches and athletes plan the work, see the numbers, and track what actually changes.
Frequently asked questions
Frequently asked questions

BE Performance

