Coach
Coach
Coach
8
8
8
min
min
min
Henry Latimer
Henry Latimer
Reading the Story of a Race
Reading the Story of a Race
What the Data Really Tells Us
What the Data Really Tells Us
Henry Latimer, coach and founder of Cycling Coach Henry, brings a decade of experience working across road, track, cyclocross and ultra-endurance. He has coached national champions, Invictus Games gold medallists, and Great Britain Cycling Team athletes and he races himself.
We asked Henry to share how he approaches race analysis with Vekta. What he wrote isn't a product walkthrough. It's a philosophy, one that we think cuts to the heart of why data exists in sport. Not to replace judgement, but to sharpen it.
Over to Henry.
Reading the Story of a Race: What the Data Really Tells Us
By Henry Latimer
We live in a data-rich world, especially in performance cycling. It's easy to believe that numbers alone can win races. Sure, for the very best in the world, their physiology can make them almost unbeatable. But for 90% of high-level racers, the nuance lies within the art of racing.
How efficient were they in the bunch? Did they manage their effort before key climbs? Did they hide well enough before launching their big attack? These questions don't just shape tactics. They shape outcomes.
The art of racing does, however, leave its mark within the data. The data helps us understand the picture and examine in-race decisions with objective clarity. When we look at a race file alongside subjective feedback, it tells us how a race really unfolded.
Power and Heart Rate Only Tell Part of the Story
When we review a race, we need to interpret information and identify decisive moments. We look for both output and cost within different metrics in a file, aiming to understand the efforts of a rider during key moments. As we start to identify these elements within the data, we also overlay subjective feedback to help us build greater context.
Traditional post-race analysis has been driven by power and heart rate. Power has always shown us the output; heart rate helps us understand the internal cost. These metrics are important, but do they help us understand the story of a race? Power traces can hide key efforts, and heart rate often lags behind during decisive moments.
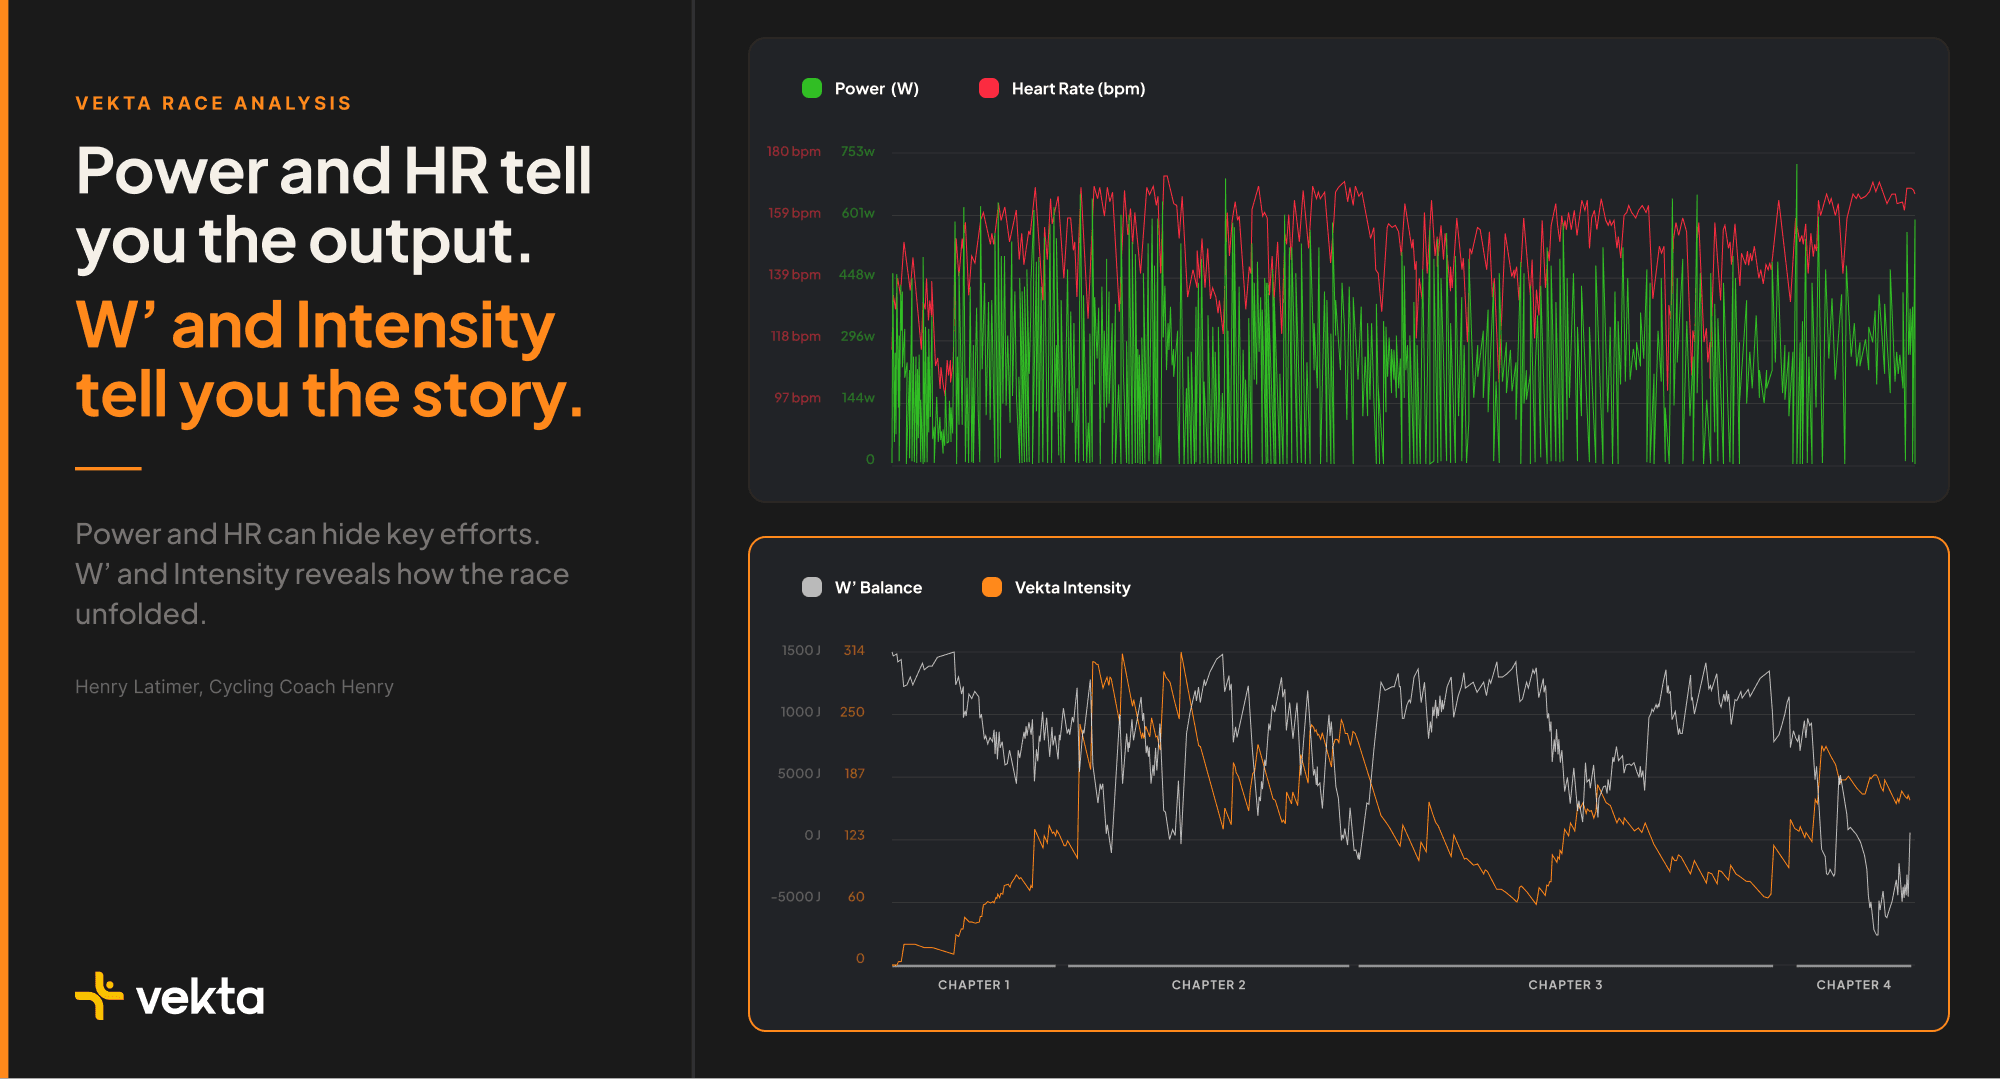
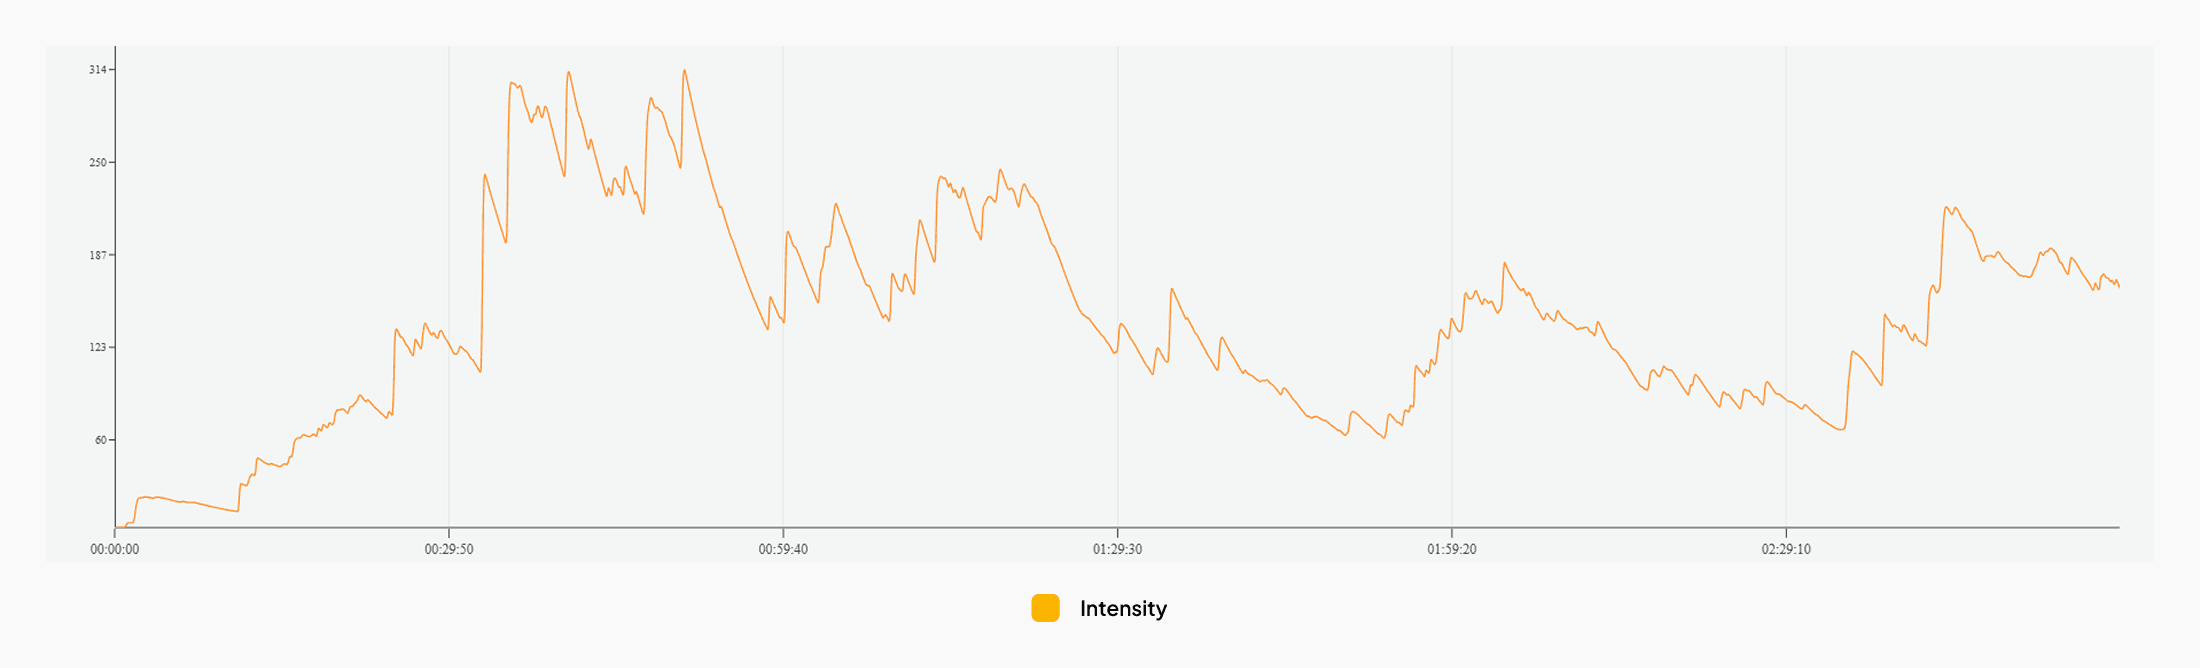
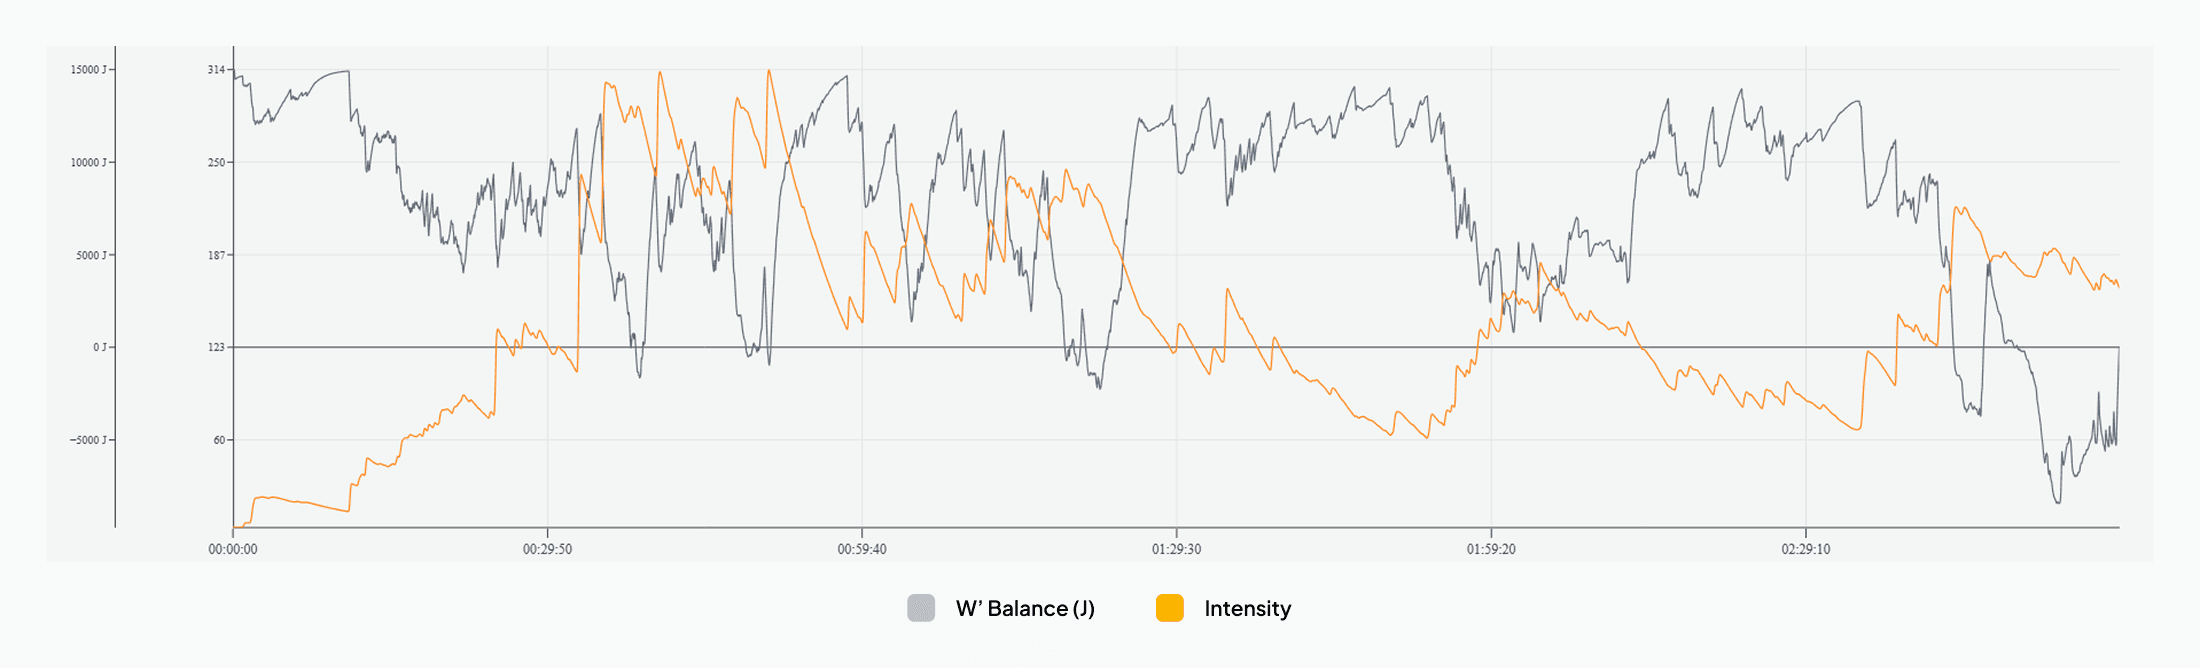
Intensity Stream: The Data Has Chapters
The Intensity stream within Vekta tells a much clearer story. We now start to see how the race unfolded. Where did the early efforts occur? Were there clusters of surges before the race settled into its natural rhythm? The Intensity stream doesn't just show effort, it reveals structure. It gives the race its chapters.
What we still don’t understand is the cost of these efforts, and how they affect a rider's available energy… Enter W’ balance.
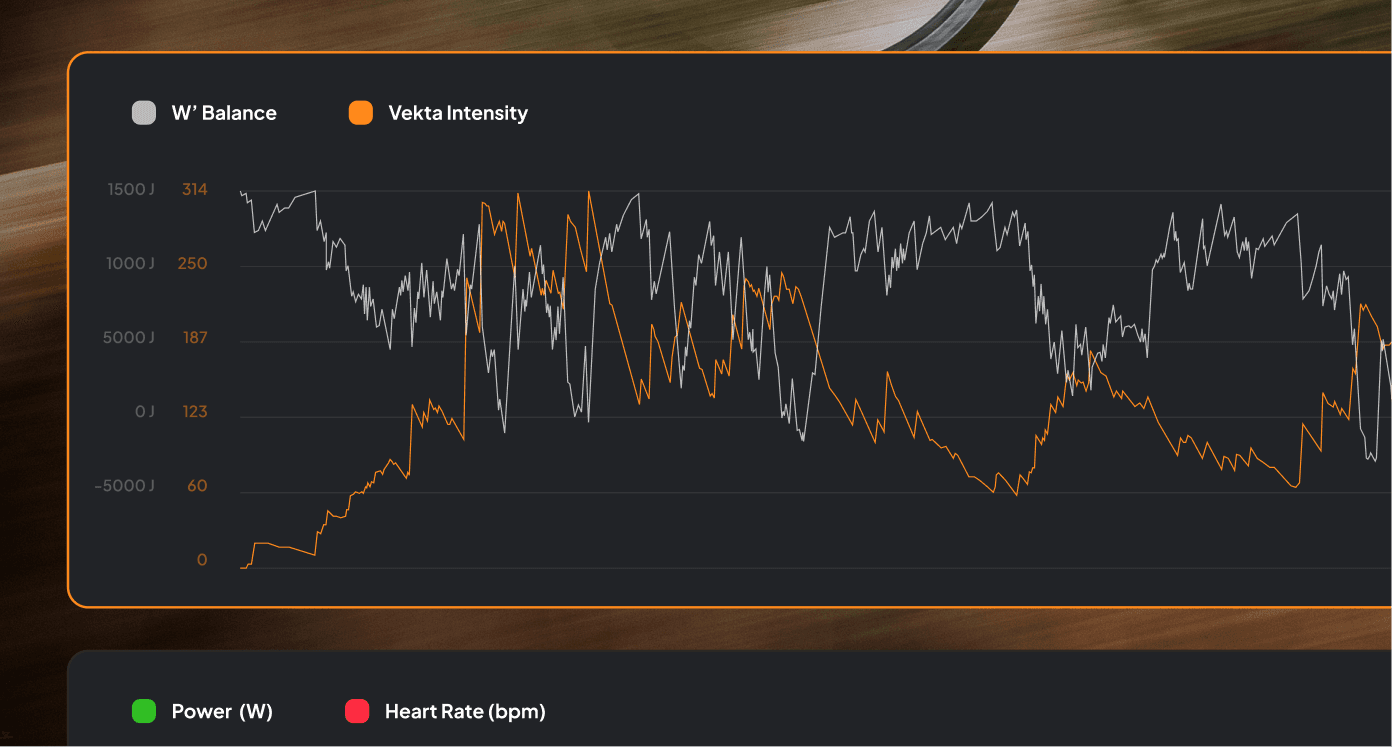
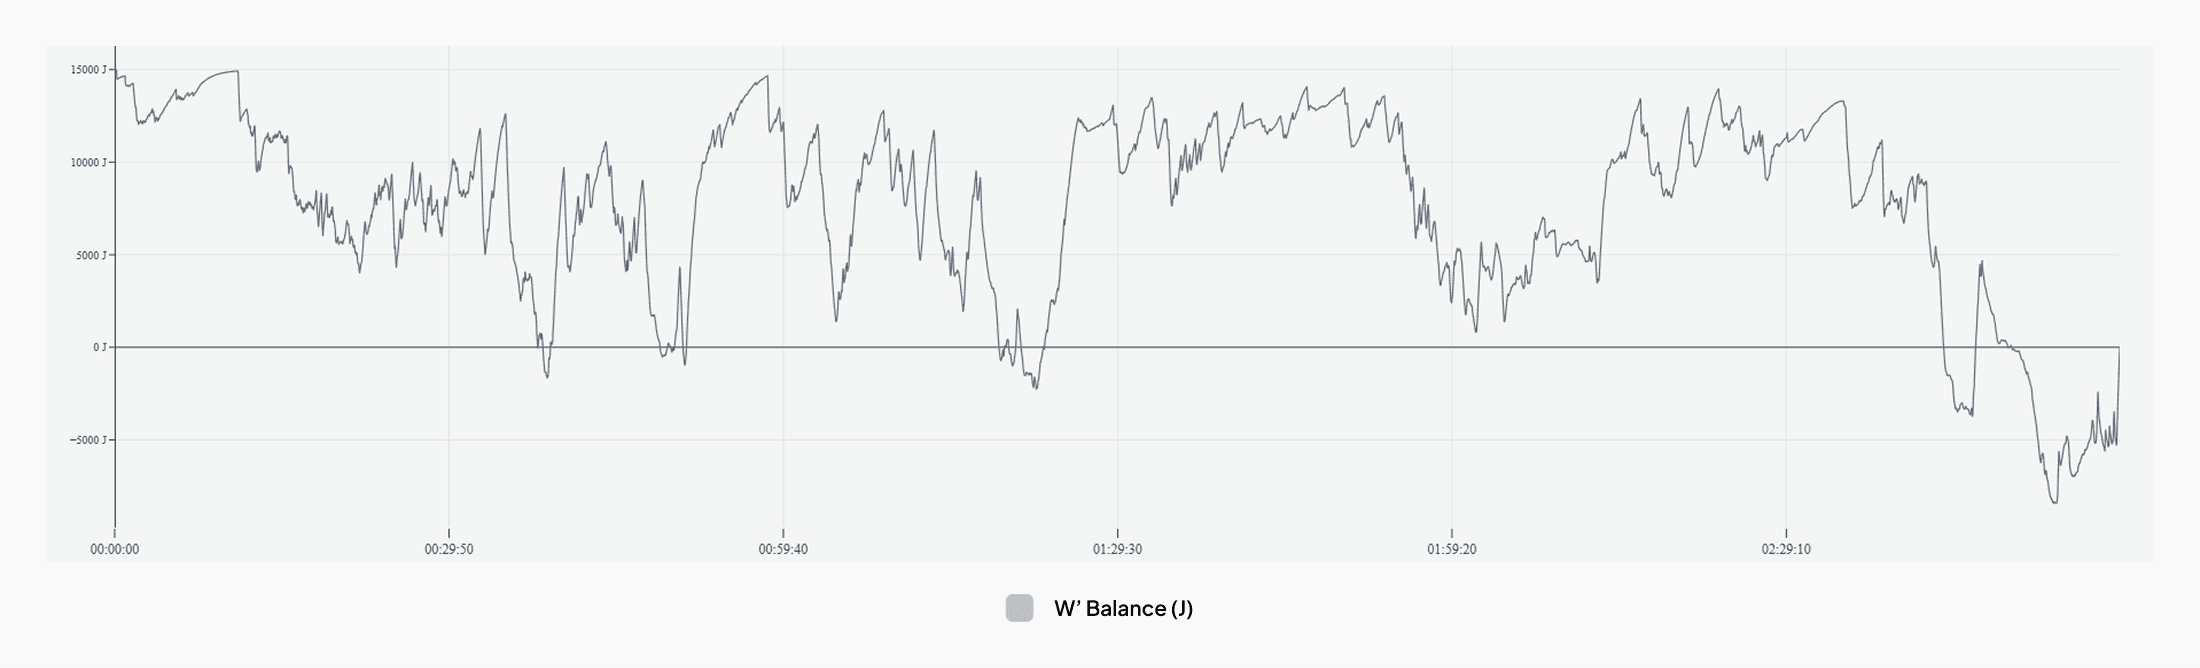
W′ Balance Tells Us When the Race Was Really Won or Lost
W′ balance is a real-time reflection of your work capacity above critical power. Think of it as your high-intensity battery. If we go too hard for too long, we need to drop below critical power in order to recharge and push hard again. It is a modelled reflection showing the physiological cost of high-intensity efforts. W′ balance can also help us understand where the rider was under the most cognitive stress, giving important context to decisions at key moments.
In our case study rider, you can see exactly this dynamic playing out. Watch how W′ depletes through the hilly middle section of the race, recovers during the mid-race lull, and is held in reserve, deliberately for the winning move in the finale.
We've now identified where the race got hard and how that affected our rider. The key context is added when we start to understand our rider's subjective feedback. How did they feel early in the race? Did they recover sufficiently after surges in the first hour? Did they stick to their pre-race strategy?
Combining all these tools gives us powerful insight into a race.
So Would You Like Me to Tell You a Story?
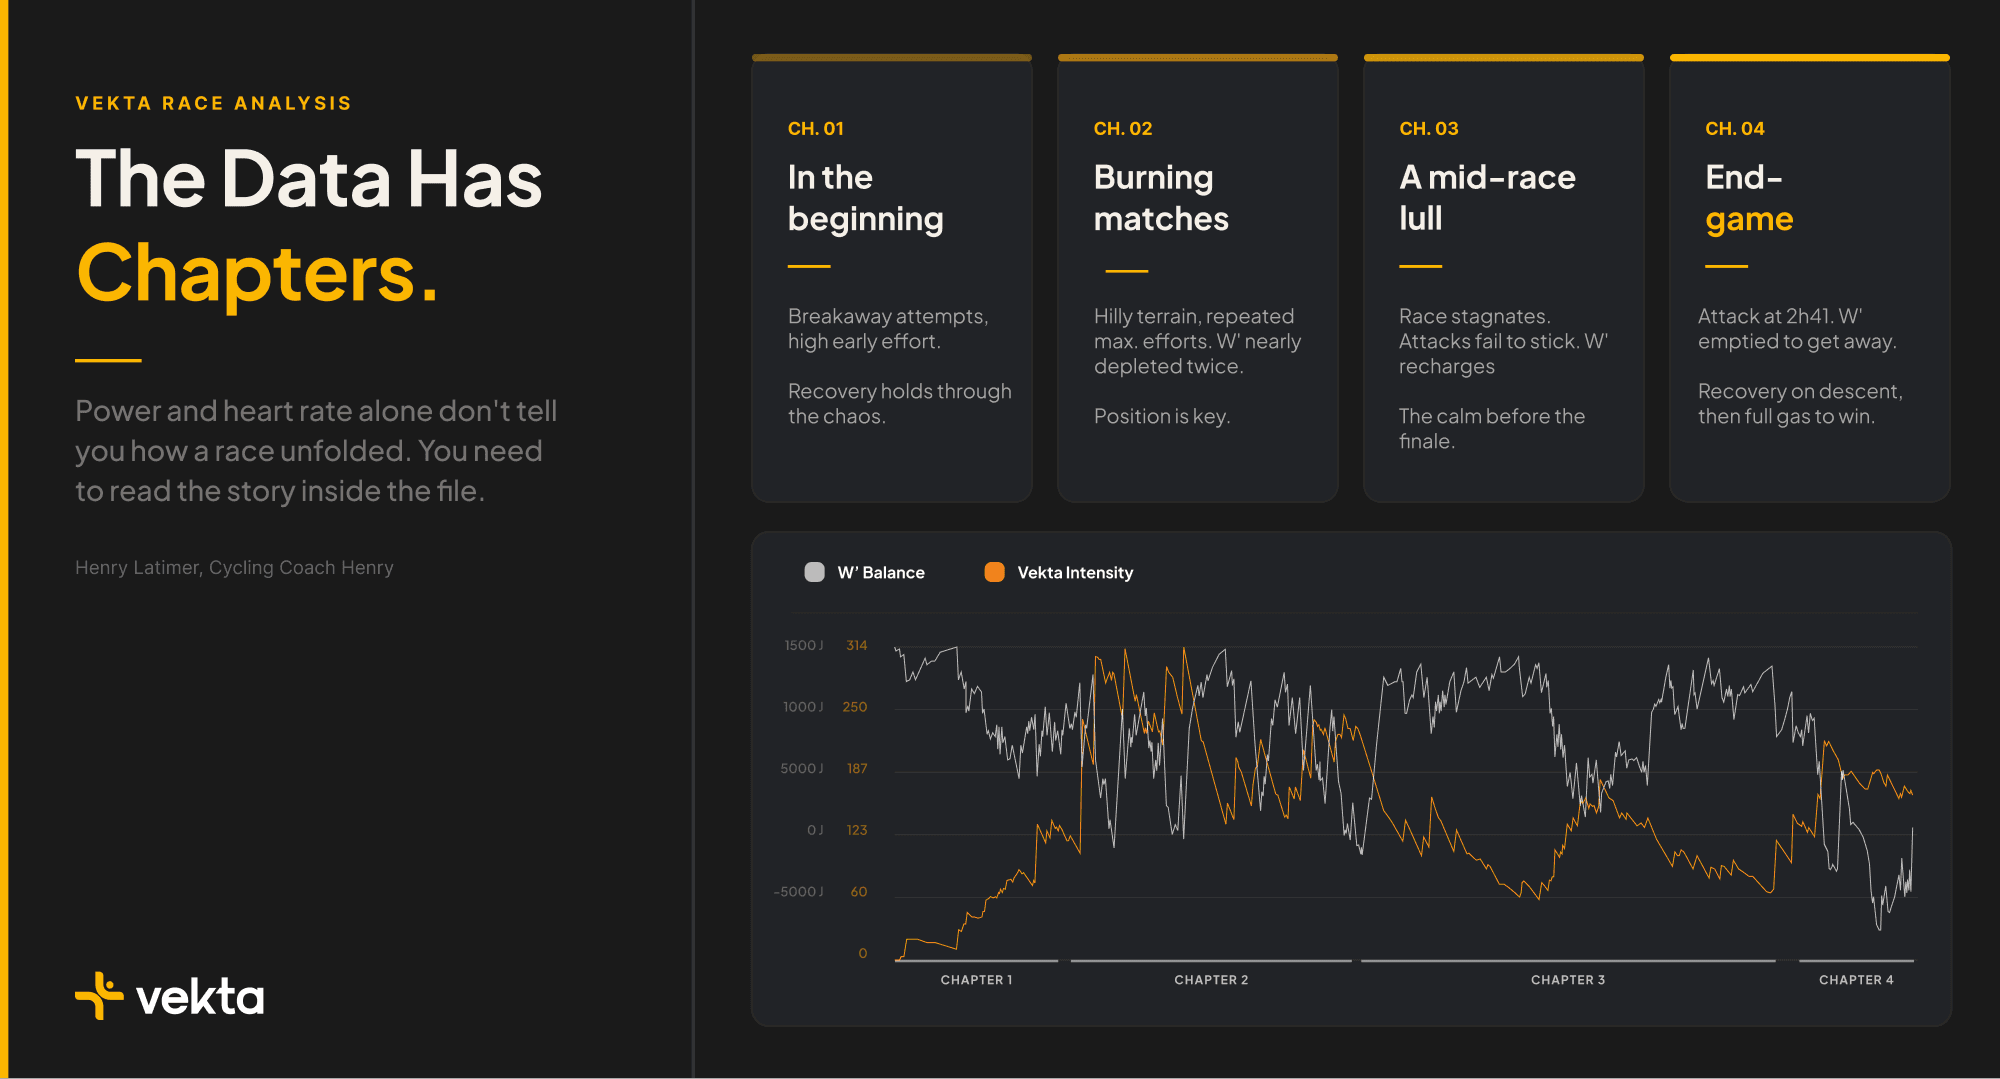
Chapter 1: In the beginning
The early part of this race was fast, with a high level of effort from our rider due to lots of teams attacking to try and form an early breakaway. Our rider managed her effort well and, despite having to push hard, she recovered effectively and had plenty of energy left in the tank for Chapter 2.
Chapter 2: Burning matches
This was the hardest part of the race, a hilly section of the course with repeated efforts at close to max. We can see that our rider was pretty empty on two occasions during this phase, but managed her effort well and recovered after each climb. She told me that she was well positioned on all of these sections, and this was important in helping her recover quickly between efforts.
Chapter 3: A mid-race lull
After 90 minutes the race had settled. Lots of attacks were attempted by multiple riders, to no avail. The race stagnated and our rider had an opportunity to recover. There was a short burst of intensity around two hours, but with tired legs in the bunch it could not be sustained for long. Our rider was preparing for her final move.
Chapter 4: Endgame
Our rider had identified two possible climbs in the finale where she would launch her attack. The race had stayed together, and everything was aligning to allow this strategy to come to fruition. We can clearly see the attack at 2h41, where our rider emptied her W′ balance to get away. A short recovery on a descent saw the battery recharge before it was full gas to the finish line and the race win.
A Rider Who Understands the Cost of Their Choices
A data-informed approach to race analysis, supported by subjective feedback, is the most effective way to understand how races unfold. In our example the rider was victorious, but often we learn most from our least impressive results. Understanding why we failed and where we can make changes is the secret sauce. This gives coaches a powerful tool to help riders reflect on decisions and improve their performance in future.
A rider who understands the cost of their choices in races is a dangerous rider. They race with intention, they make better decisions, they control the narrative.
Henry Latimer is a British Cycling Level 3 Road & Time Trial Coach, Association of British Cycle Coaches Level 3 Coach, and British Cycling Coaching Scholarship Graduate. He has coached athletes across road, track, cyclocross and ultra-endurance disciplines, from beginners to national champions and beyond. You can find out more at cyclingcoachhenry.com.
Henry Latimer, coach and founder of Cycling Coach Henry, brings a decade of experience working across road, track, cyclocross and ultra-endurance. He has coached national champions, Invictus Games gold medallists, and Great Britain Cycling Team athletes and he races himself.
We asked Henry to share how he approaches race analysis with Vekta. What he wrote isn't a product walkthrough. It's a philosophy, one that we think cuts to the heart of why data exists in sport. Not to replace judgement, but to sharpen it.
Over to Henry.
Reading the Story of a Race: What the Data Really Tells Us
By Henry Latimer
We live in a data-rich world, especially in performance cycling. It's easy to believe that numbers alone can win races. Sure, for the very best in the world, their physiology can make them almost unbeatable. But for 90% of high-level racers, the nuance lies within the art of racing.
How efficient were they in the bunch? Did they manage their effort before key climbs? Did they hide well enough before launching their big attack? These questions don't just shape tactics. They shape outcomes.
The art of racing does, however, leave its mark within the data. The data helps us understand the picture and examine in-race decisions with objective clarity. When we look at a race file alongside subjective feedback, it tells us how a race really unfolded.
Power and Heart Rate Only Tell Part of the Story
When we review a race, we need to interpret information and identify decisive moments. We look for both output and cost within different metrics in a file, aiming to understand the efforts of a rider during key moments. As we start to identify these elements within the data, we also overlay subjective feedback to help us build greater context.
Traditional post-race analysis has been driven by power and heart rate. Power has always shown us the output; heart rate helps us understand the internal cost. These metrics are important, but do they help us understand the story of a race? Power traces can hide key efforts, and heart rate often lags behind during decisive moments.
Intensity Stream: The Data Has Chapters
The Intensity stream within Vekta tells a much clearer story. We now start to see how the race unfolded. Where did the early efforts occur? Were there clusters of surges before the race settled into its natural rhythm? The Intensity stream doesn't just show effort, it reveals structure. It gives the race its chapters.
What we still don’t understand is the cost of these efforts, and how they affect a rider's available energy… Enter W’ balance.
W′ Balance Tells Us When the Race Was Really Won or Lost
W′ balance is a real-time reflection of your work capacity above critical power. Think of it as your high-intensity battery. If we go too hard for too long, we need to drop below critical power in order to recharge and push hard again. It is a modelled reflection showing the physiological cost of high-intensity efforts. W′ balance can also help us understand where the rider was under the most cognitive stress, giving important context to decisions at key moments.
In our case study rider, you can see exactly this dynamic playing out. Watch how W′ depletes through the hilly middle section of the race, recovers during the mid-race lull, and is held in reserve, deliberately for the winning move in the finale.
We've now identified where the race got hard and how that affected our rider. The key context is added when we start to understand our rider's subjective feedback. How did they feel early in the race? Did they recover sufficiently after surges in the first hour? Did they stick to their pre-race strategy?
Combining all these tools gives us powerful insight into a race.
So Would You Like Me to Tell You a Story?
Chapter 1: In the beginning
The early part of this race was fast, with a high level of effort from our rider due to lots of teams attacking to try and form an early breakaway. Our rider managed her effort well and, despite having to push hard, she recovered effectively and had plenty of energy left in the tank for Chapter 2.
Chapter 2: Burning matches
This was the hardest part of the race, a hilly section of the course with repeated efforts at close to max. We can see that our rider was pretty empty on two occasions during this phase, but managed her effort well and recovered after each climb. She told me that she was well positioned on all of these sections, and this was important in helping her recover quickly between efforts.
Chapter 3: A mid-race lull
After 90 minutes the race had settled. Lots of attacks were attempted by multiple riders, to no avail. The race stagnated and our rider had an opportunity to recover. There was a short burst of intensity around two hours, but with tired legs in the bunch it could not be sustained for long. Our rider was preparing for her final move.
Chapter 4: Endgame
Our rider had identified two possible climbs in the finale where she would launch her attack. The race had stayed together, and everything was aligning to allow this strategy to come to fruition. We can clearly see the attack at 2h41, where our rider emptied her W′ balance to get away. A short recovery on a descent saw the battery recharge before it was full gas to the finish line and the race win.
A Rider Who Understands the Cost of Their Choices
A data-informed approach to race analysis, supported by subjective feedback, is the most effective way to understand how races unfold. In our example the rider was victorious, but often we learn most from our least impressive results. Understanding why we failed and where we can make changes is the secret sauce. This gives coaches a powerful tool to help riders reflect on decisions and improve their performance in future.
A rider who understands the cost of their choices in races is a dangerous rider. They race with intention, they make better decisions, they control the narrative.
Henry Latimer is a British Cycling Level 3 Road & Time Trial Coach, Association of British Cycle Coaches Level 3 Coach, and British Cycling Coaching Scholarship Graduate. He has coached athletes across road, track, cyclocross and ultra-endurance disciplines, from beginners to national champions and beyond. You can find out more at cyclingcoachhenry.com.
Frequently asked questions

Cycling Coach Henry


Dream big with Vekta, the most advanced training and coaching platform.

Ce projet a été financé par la Région et/ou par l’État dans le cadre de France 2030
© 2026 — Copyright - GRAIG SAS
Dream big with Vekta, the most advanced training and coaching platform.
Ce projet a été financé par la Région et/ou par l’État dans le cadre de France 2030
© 2026 — Copyright - GRAIG SAS