
Performance Science
Performance Science
Performance Science
12
12
12
min
min
min
Dominic Valerio
Dominic Valerio
Automatic Interval Detection: Vekta vs TrainingPeaks
Automatic Interval Detection: Vekta vs TrainingPeaks
Automatic Interval Detection Comparison:
Vekta vs TrainingPeaks
Published: Q1 2026
Summary
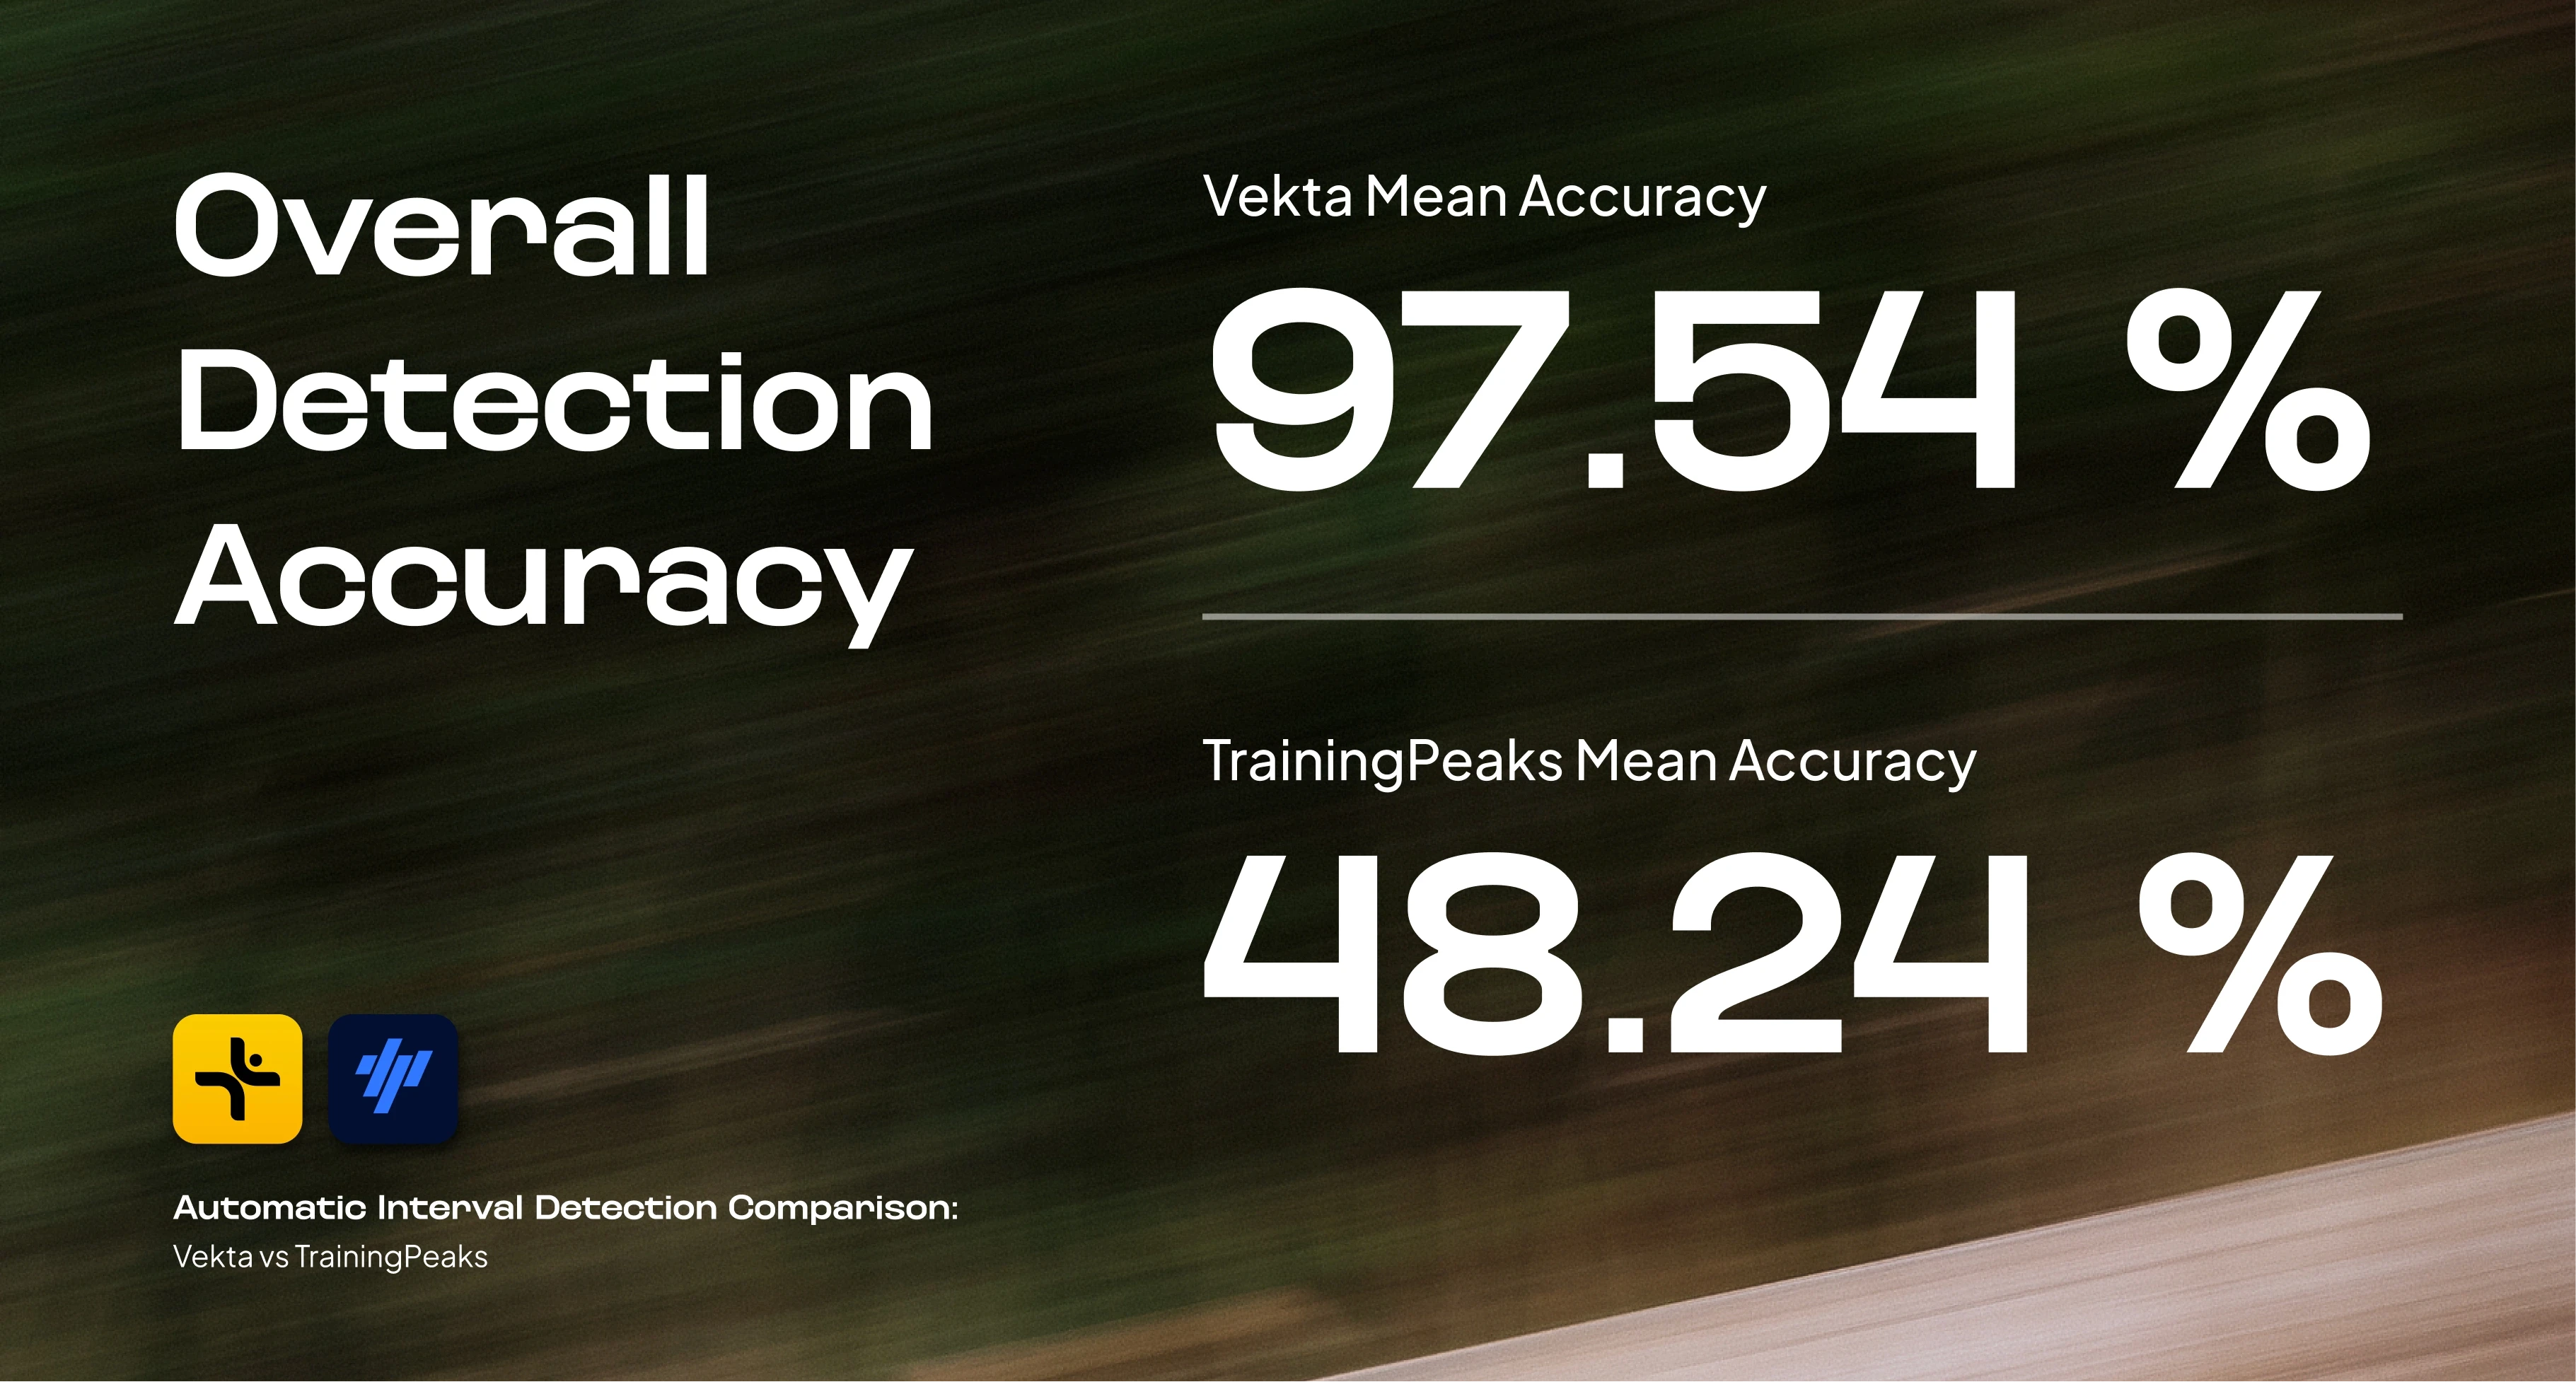
In this controlled 50-session benchmark, Vekta demonstrated significantly higher automatic interval detection accuracy than TrainingPeaks across all structural formats.
50 identical cycling sessions were processed on Vekta and TrainingPeaks.
All sessions were independently validated by two data scientists to establish verified interval counts.
Mean detection accuracy was 97.54% on Vekta compared with 48.24% on TrainingPeaks.
Perfect interval detection occurred in 43 of 50 sessions on Vekta and 9 of 50 sessions on TrainingPeaks.
24 sessions fell below 50% accuracy on TrainingPeaks. None did on Vekta.
On average, Vekta misidentified 0.26 intervals per session, compared with 6.06 intervals per session on TrainingPeaks.
Automatic interval detection is becoming foundational to endurance analysis. This benchmark evaluates how two fundamentally different implementations perform under identical, controlled conditions.
Introduction
For years, analysing structured training required manual work. Coaches and athletes reviewed power files, identified intervals, and interpreted the structure and data of a session themselves.
Automatic interval detection changes that. Instead of manually defining intervals, platforms now interpret raw power files and automatically identify meaningful blocks. When implemented correctly, it reduces workload and increases consistency. When implemented poorly, it silently distorts the analytical foundation of a session.
At Vekta, we introduced automatic interval detection to endurance world. Recently, TrainingPeaks launched its own implementation. As adoption expands across platforms, benchmarking quality becomes essential.
This study evaluates how the two systems perform under identical conditions.
To assess this directly, we conducted a controlled side-by-side comparison between Vekta and TrainingPeaks. Fifty identical cycling sessions were analysed using the same raw files, independently validated with no manual intervention.
All interval counts were validated by two data scientists prior to scoring.
Why Interval Detection Is Foundational
Automatic interval detection is not simply a visual feature. At Vekta it is the entry point to the analytical model.
Every detected interval feeds directly into intensity classification relative to Critical Power, distribution of work across physiological domains, identification of the dominant training stimulus, and session-level modelling that supports long-term load tracking and performance analysis.
Detection is therefore the first layer in a multi-layer analytical stack.
If detection is inaccurate, intensity classification becomes distorted, stimulus assignment shifts, and session summaries misrepresent the physiological demand of the workout. Over time those errors compound, affecting aggregated workload metrics and long-term performance modelling.
Detection accuracy is therefore not just about visual segmentation. It determines whether the analytical model reflects the training session that actually occurred.
Architectural Differences in Detection Logic
The difference in detection accuracy begins with how each system identifies intervals. At Vekta, interval detection is built around a machine learning model, while TrainingPeaks relies on rule-based thresholds.
TrainingPeaks: Rule-Based Interval Detection
TrainingPeaks detects intervals using a fixed 7-zone power model with predefined duration thresholds. Only efforts above Zone 3 are eligible for detection, and intervals are triggered once a specific intensity–duration rule is satisfied. This approach works well when efforts are clearly separated and power remains relatively stable throughout the interval.
However, real training sessions are rarely that clean. In practice, sessions often include:
Sub-threshold work blocks
Tightly spaced intervals
Progressive threshold builds
Mixed-intensity sets
Variable cadence efforts
Irregular work-recovery transitions
When detection relies strictly on fixed statistical thresholds, these variations can cause intervals to be fragmented, merged, or missed entirely.
Vekta: Pattern-Based Detection Using Machine Learning
Vekta approaches interval detection differently. Instead of relying solely on fixed zone triggers, Vekta uses a machine learning model trained on real training sessions. The model evaluates patterns of effort relative to an athlete’s Critical Power and interprets transitions between work and recovery across the entire session.
Rather than simply asking whether power exceeds a threshold for a set period of time, the system analyses how effort evolves over the course of the workout.
As training sessions become more complex, these architectural differences have a significant impact on detection accuracy.
Detection Model Comparison
Detection Dimension | Vekta | TrainingPeaks |
|---|---|---|
Detection Logic | Dynamic interpretation relative to CP | Fixed 7-zone trigger rules |
Algorithm Type | Machine learning model trained on real sessions | Rule-based statistical thresholds |
Minimum Duration Rules | Adaptive | Fixed per zone |
Sub-Zone 3 Detection | Included where structurally meaningful | Not detected |
Structural Interpretation | Pattern-based | Trigger-based intensity gating |
Methodology
50 structured cycling sessions
Same raw power files processed independently on both platforms
No manual correction applied
Verified ground truth interval counts established prior to testing
Both platforms evaluated using default automatic detection logic
Overall Detection Accuracy: Vekta vs TrainingPeaks
Summary Metrics
Metric | Vekta | TrainingPeaks |
|---|---|---|
Mean Accuracy | 97.54% | 48.24% |
Median Accuracy | 100% | 55% |
Perfect Sessions | 43 | 9 |
Sessions <80% | 3 | 35 |
Sessions <50% | 0 | 24 |
The separation is material and consistent across the dataset. The median session on Vekta achieved full interval detection. The median session on TrainingPeaks detected just over half of the validated intervals.
In 86% of sessions, Vekta achieved perfect detection. TrainingPeaks achieved perfect detection in only 18% of sessions. This reflects a structural difference in how the two systems detect intervals, not isolated anomalies.
Median accuracy provides a more representative view of typical performance.
A median of 55% means half of sessions are above this value and half below. Unlike the mean, the median is not significantly influenced by extreme values, making it a more stable indicator when performance varies across different session types.
Accuracy Distribution
Accuracy Band | Vekta | TrainingPeaks |
|---|---|---|
100% | 43 | 9 |
90–99% | 1 | 2 |
80–89% | 2 | 4 |
50–79% | 3 | 11 |
<50% | 1 | 24 |
Vekta’s results are tightly clustered at full detection. TrainingPeaks exhibits wide spread and frequent cases of severe under-detection
Detection Accuracy by Session Format
To understand how session structure affects interval detection, workouts were grouped into three formats:
Structured – Clean
Intervals where power remains relatively stable throughout each effort.
Structured – Variable
Intervals where power fluctuates within the effort, such as over/unders or variable climbing intervals.
Mixed / Unstructured
Sessions with irregular effort patterns such as fartlek or non-uniform interval structures.
Session Format | Sessions | Vekta Mean | TrainingPeaks Mean | TP Sessions <50% |
|---|---|---|---|---|
Structured – Clean | 18 | 99.61% | 62.44% | 5 |
Structured – Variable | 12 | 99.33% | 35.92% | 7 |
Mixed / Unstructured | 20 | 94.30% | 46.40% | 12 |
TrainingPeaks performs best in Structured – Clean sessions, where intervals are clearly separated and power remains relatively steady.
As session structure becomes more variable, detection accuracy drops sharply. In Structured – Variable sessions, mean accuracy falls to 35.92%, with many intervals missed entirely.
Performance remains inconsistent in Mixed / Unstructured sessions, where irregular effort patterns make threshold-based detection more difficult.
Vekta, by contrast, maintains consistently high detection accuracy across all session formats.
Detection Accuracy by Interval Duration
Interval duration also influences detection difficulty. Very short maximal efforts tend to exceed power thresholds clearly, while longer intervals often contain power variability that makes them harder for rule-based systems to interpret.
Interval Type | Sessions | Vekta Mean | TrainingPeaks Mean |
|---|---|---|---|
Sprint (~10–20s) | 8 | 94.38% | 79.88% |
Short (30s–1min) | 16 | 98.75% | 55.81% |
Long (>2min) | 26 | 97.77% | 33.85% |
TrainingPeaks performs relatively well on very short maximal efforts. However, detection accuracy drops sharply for longer intervals where power variability within the effort becomes more significant. More complex interval structures such as over/unders or long threshold efforts are therefore harder for rule-based systems to interpret reliably.
Vekta maintains consistently high detection accuracy across all interval durations.
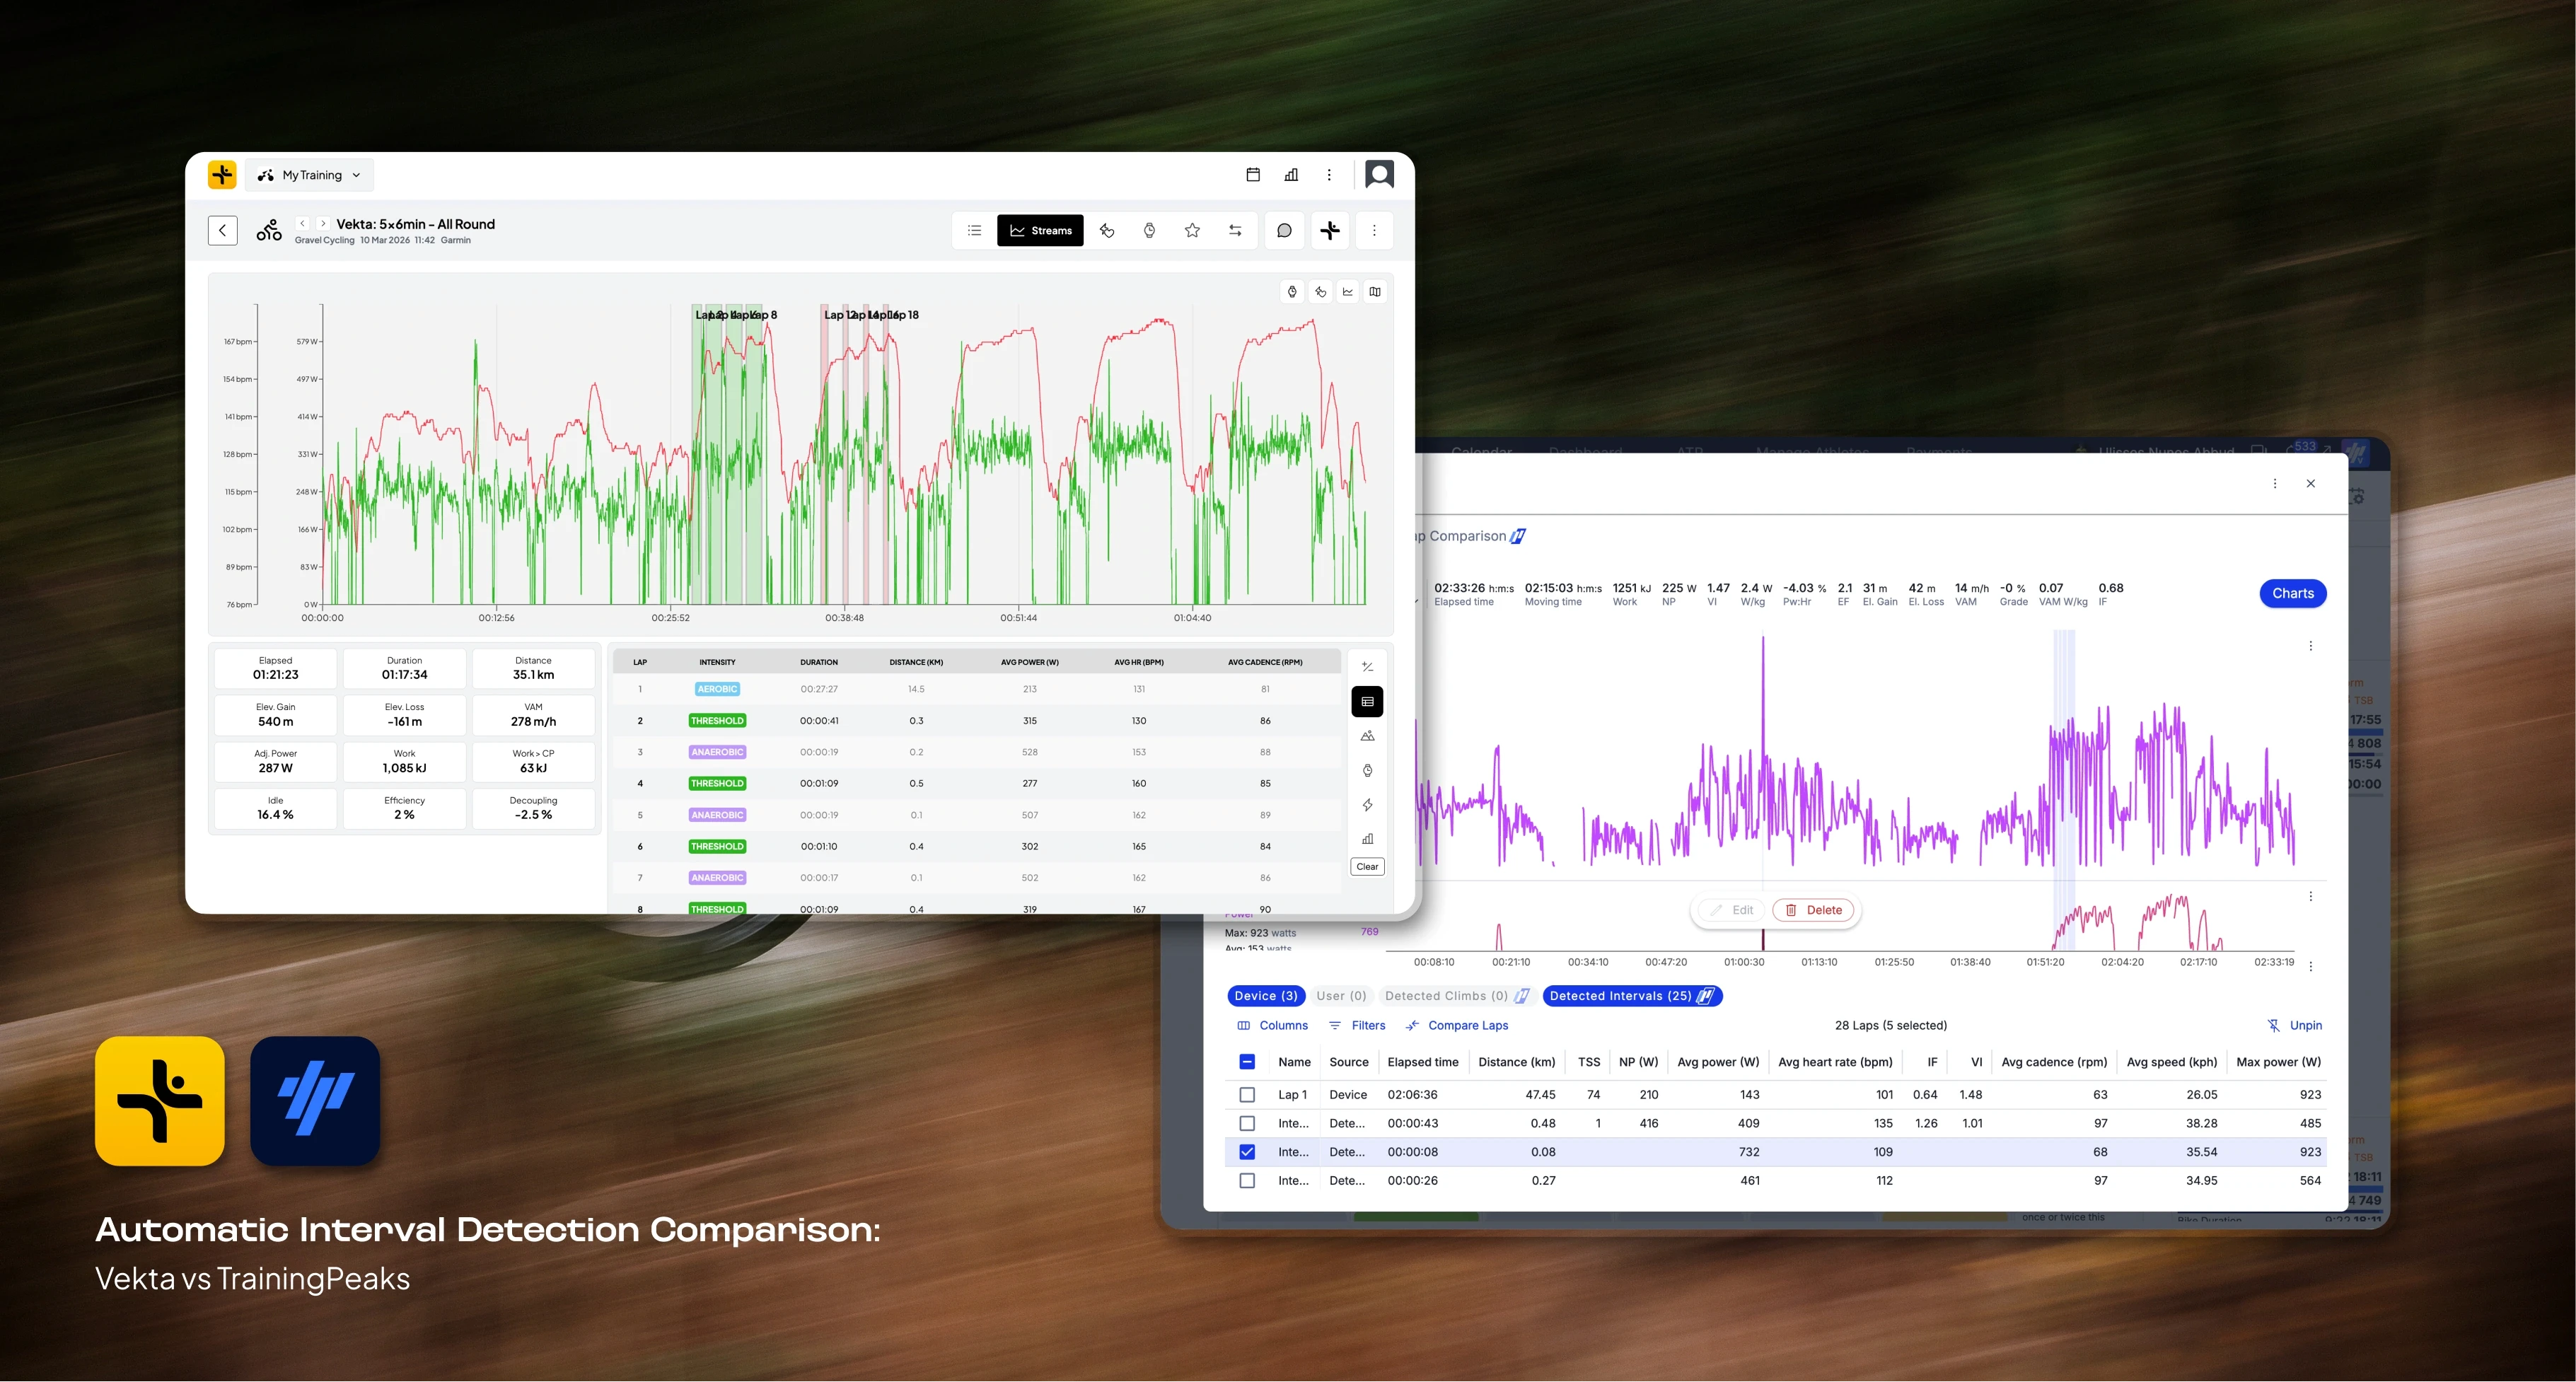
Visual Examples: How Detection Behaviour Differs in Practice
The statistical benchmark above shows a consistent difference in detection accuracy between the two systems. Looking at individual sessions helps illustrate how those differences appear in practice.
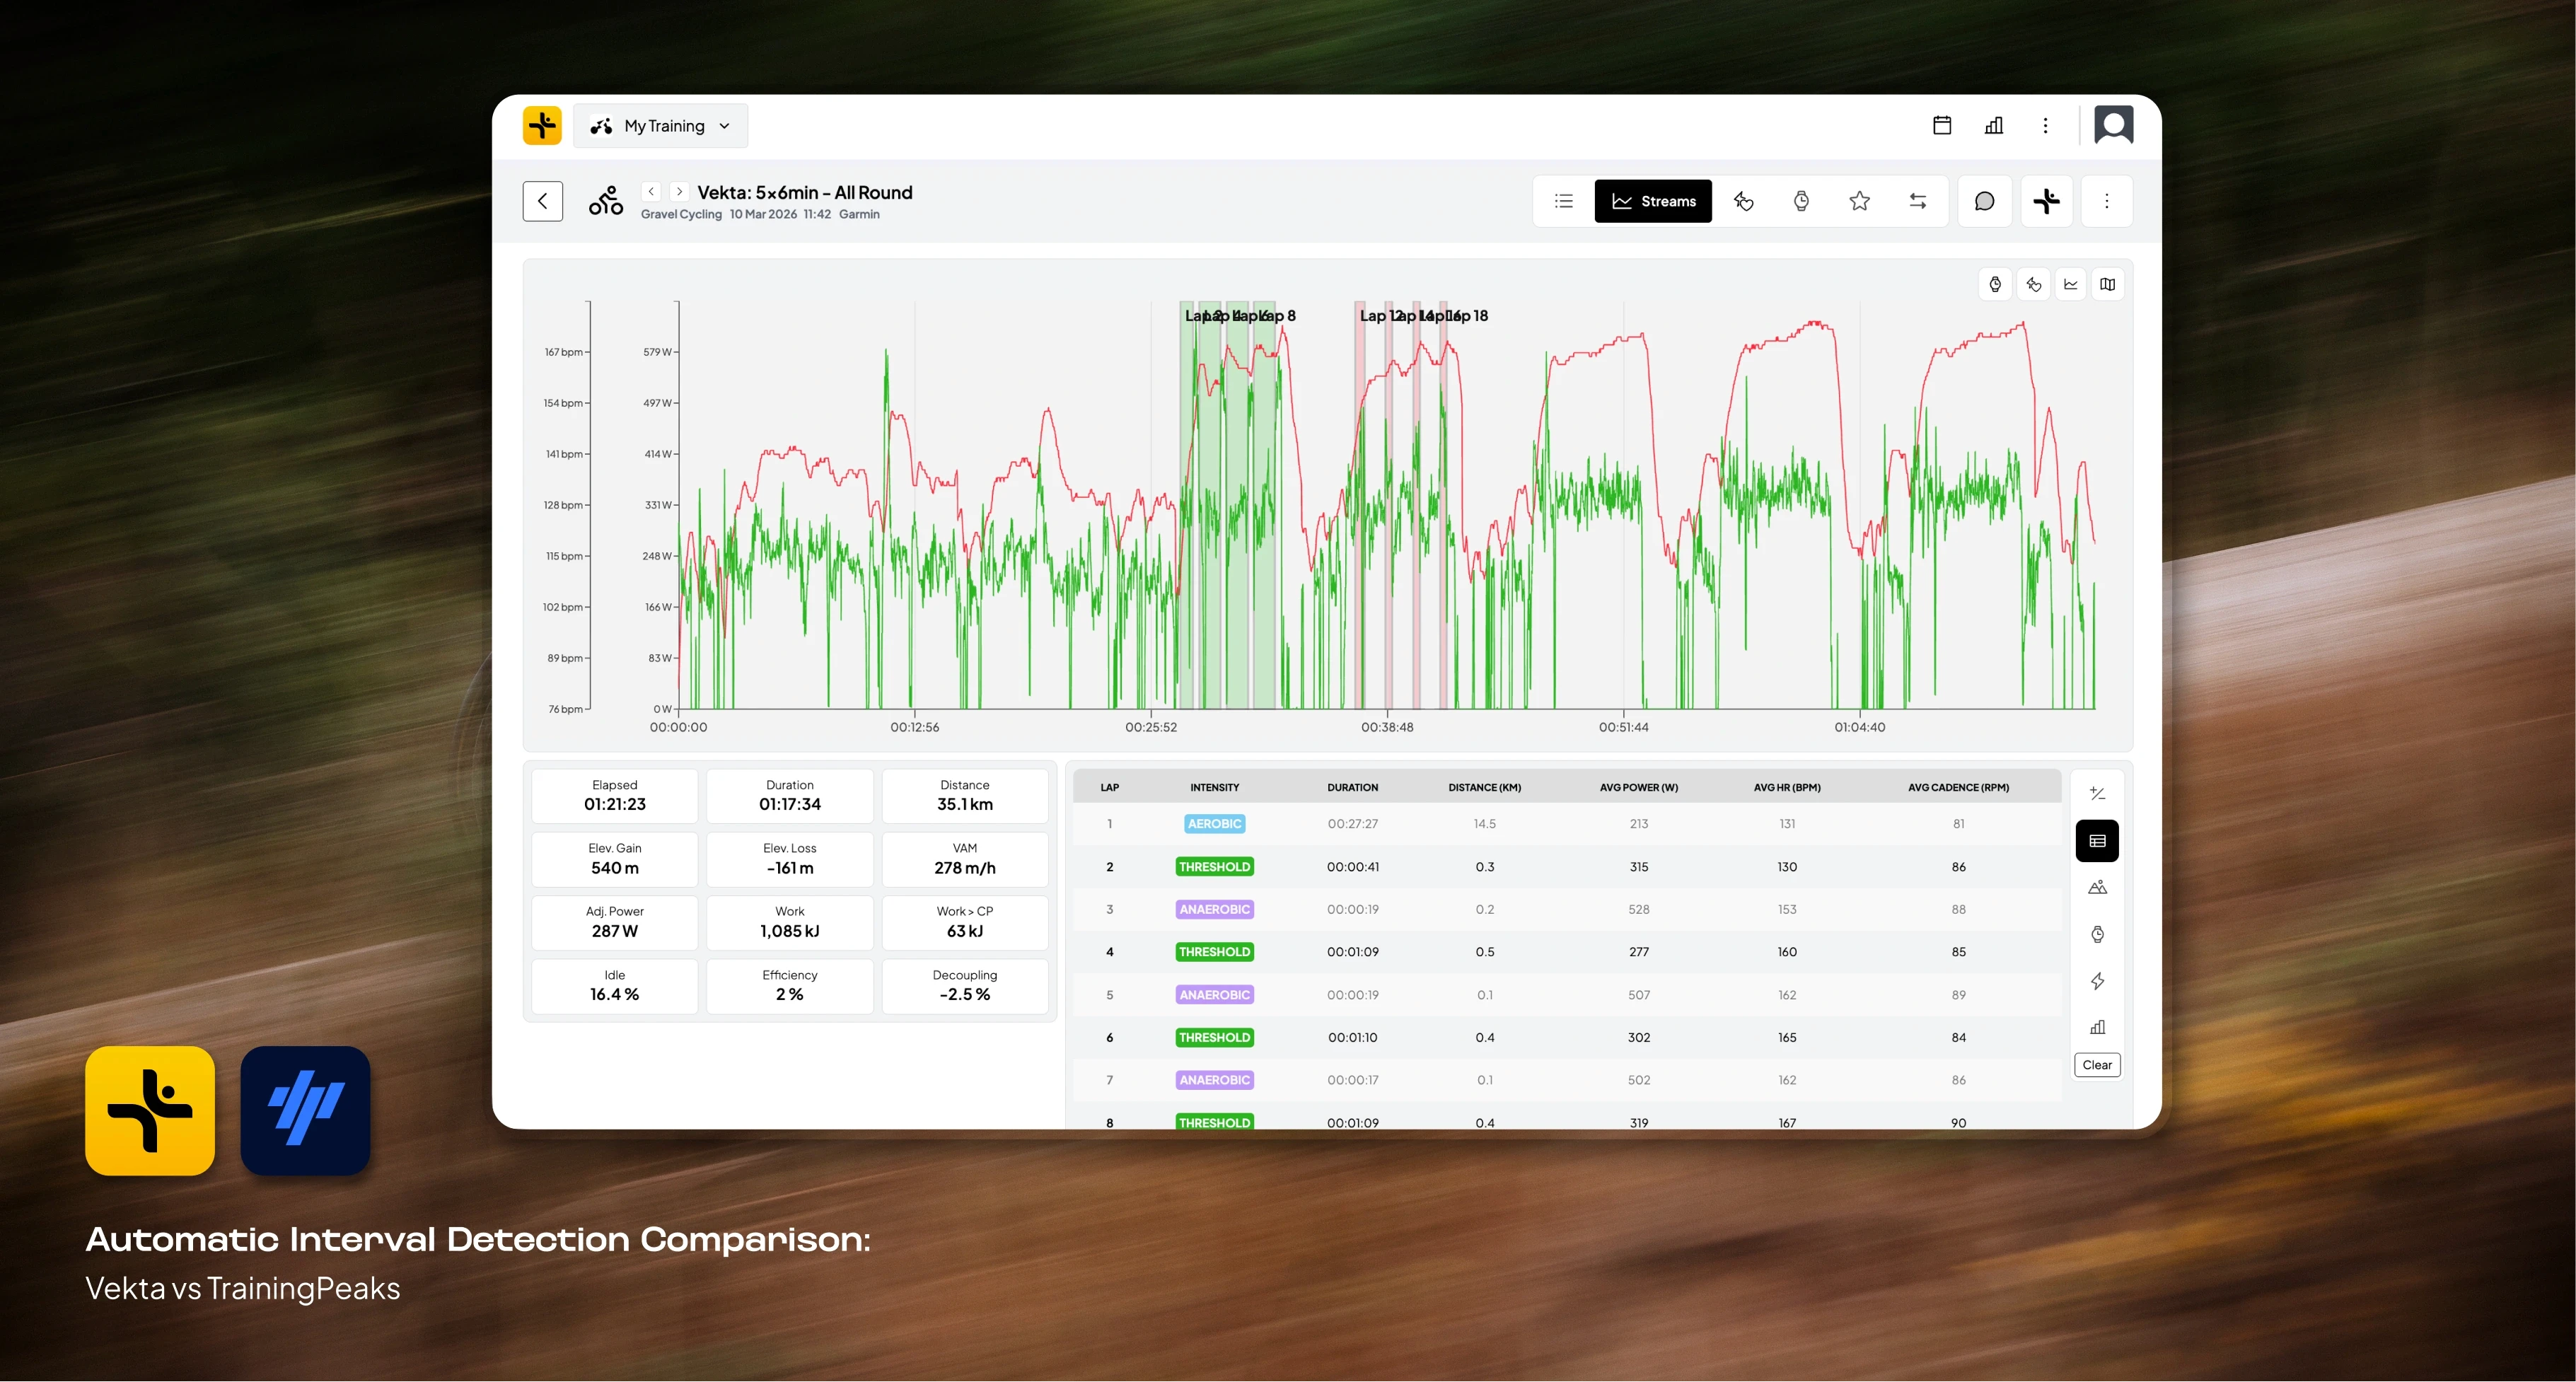
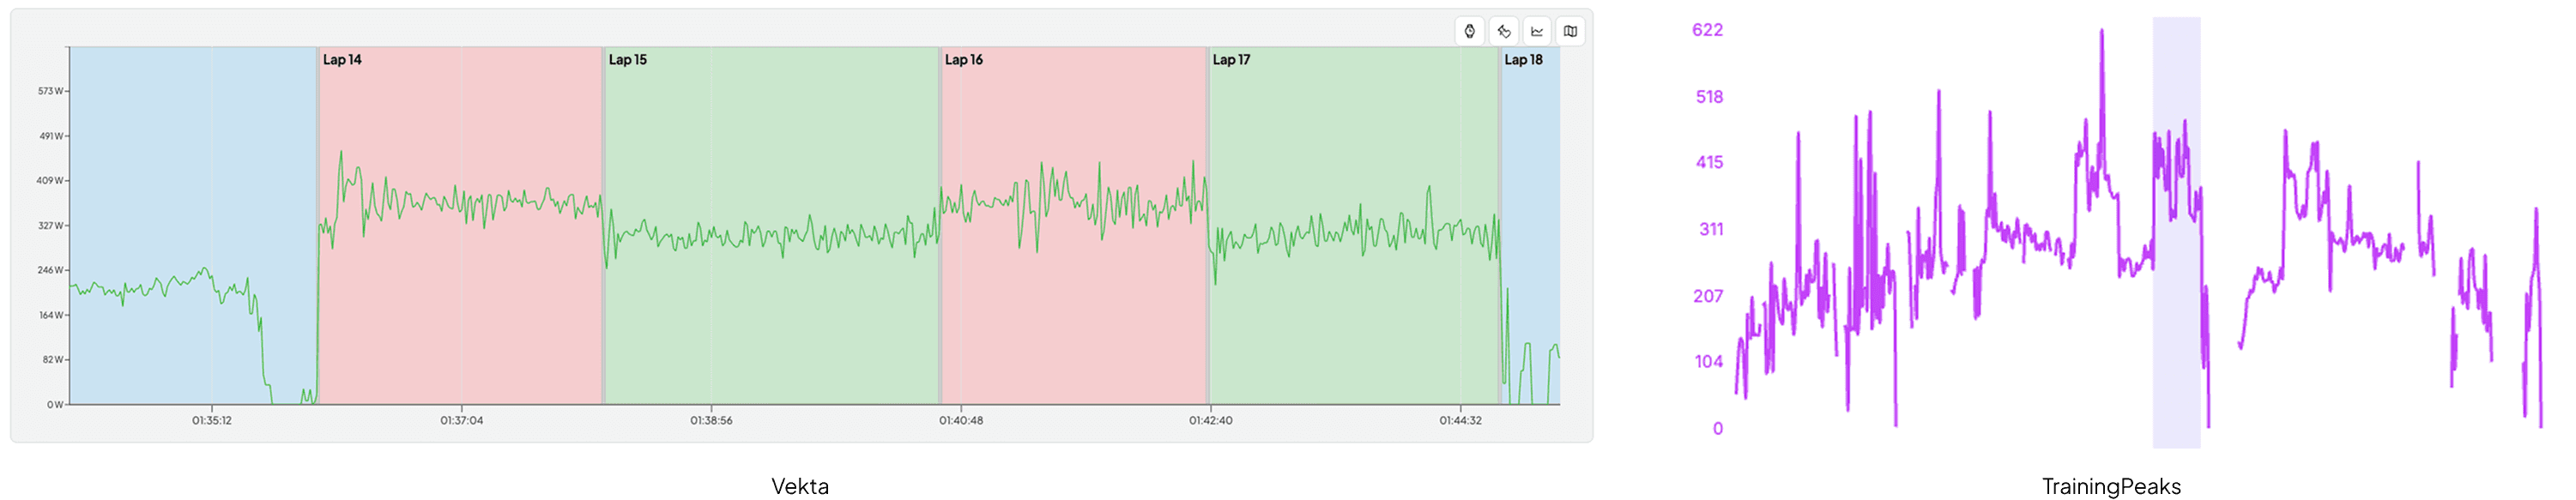
Example 1: Multiple Intervals Detected as a Single Effort
In this session, four separate work intervals were performed.
Vekta correctly identifies each interval as an independent effort block. TrainingPeaks instead interprets the entire sequence as a single interval. This occurs because the detection logic relies on threshold triggers and does not interpret the structure of the repeated effort pattern.
Vekta correctly detects 4 intervals.
TrainingPeaks interprets the sequence as a single interval.
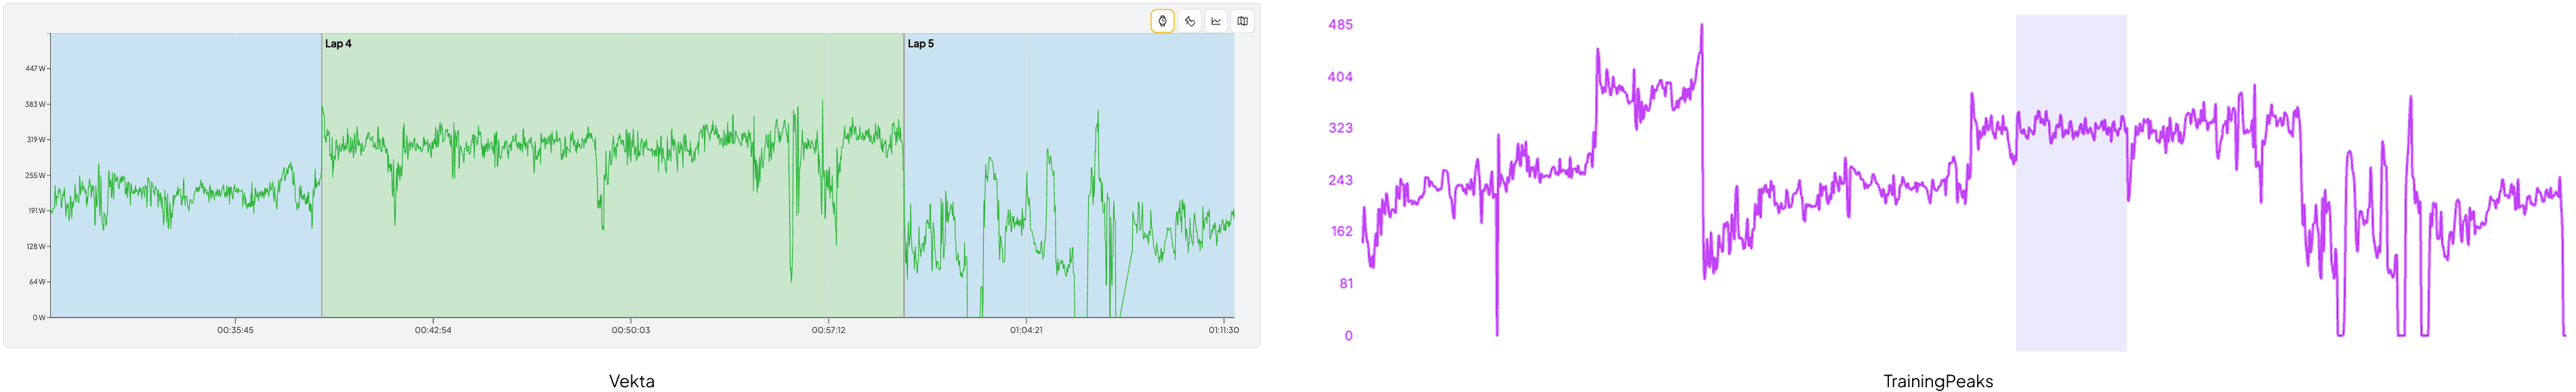
Example 2: Fragmented Detection of a Sustained Interval
In this session, a sustained threshold effort was performed.
Vekta detects the effort as a single continuous interval. TrainingPeaks fragments the same effort into multiple shorter intervals because short fluctuations in power trigger repeated threshold crossings.
Vekta detects 1 continuous interval.
TrainingPeaks fragments the effort into four intervals.
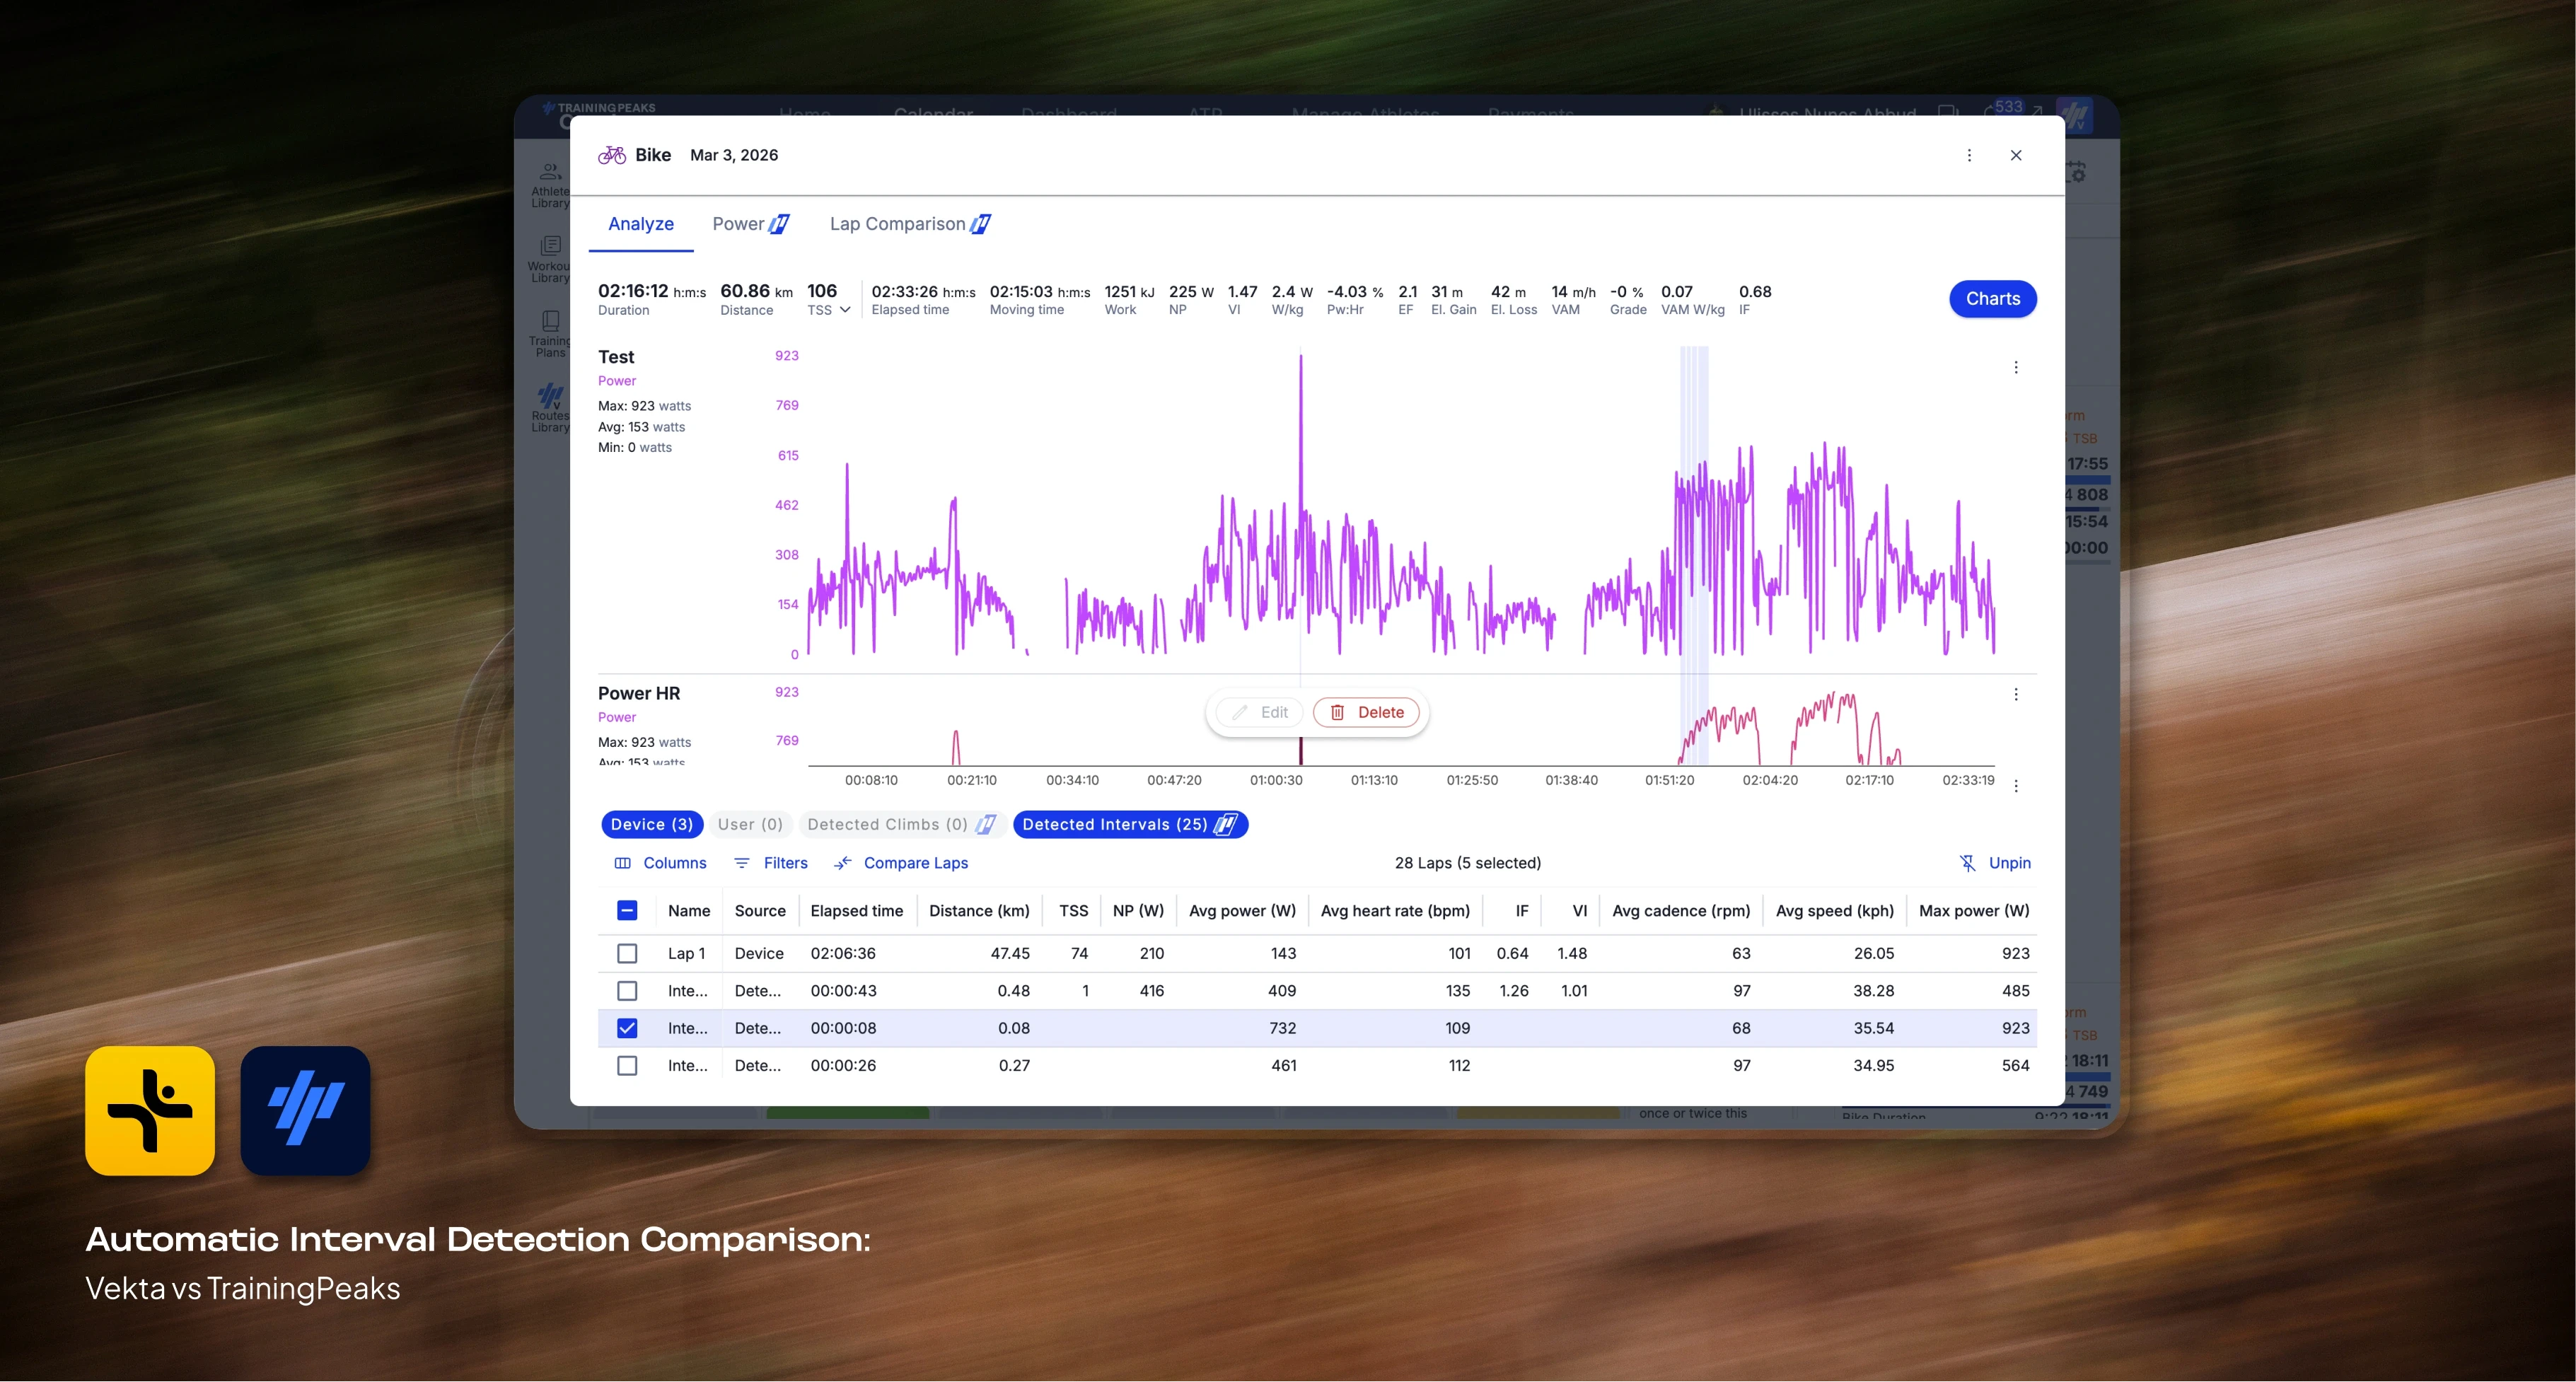
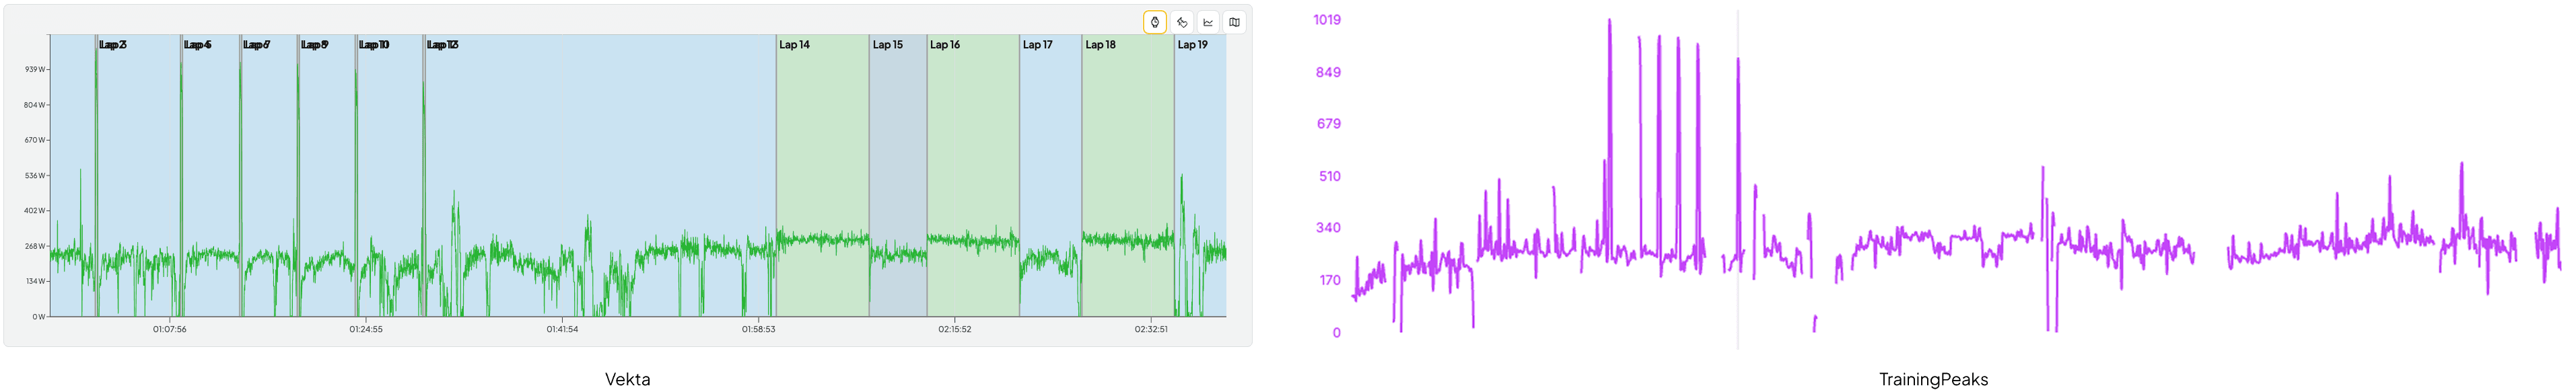
Example 3: Threshold Intervals Missed in a Mixed Session
This session contains a combination of sprint efforts followed by threshold work.
TrainingPeaks correctly identifies the short maximal sprints, where power clearly exceeds threshold triggers. However, the longer threshold intervals that follow are not detected.
Vekta identifies both the sprint efforts and the threshold intervals, preserving the full structure of the session.
TrainingPeaks detects the 6 sprints but none of the threshold intervals.
Absolute Interval Error
Absolute interval error represents the average number of intervals incorrectly detected in each session.
Metric | Vekta | TrainingPeaks |
|---|---|---|
Mean Absolute Error | 0.26 | 6.06 |
Max Absolute Error | 5 | 40 |
Zero Error Sessions | 43 | 9 |
On average, Vekta deviated by just 0.26 intervals per session, while TrainingPeaks deviated by 6.06 intervals per session.
In the most extreme case, TrainingPeaks misidentified 40 intervals within a single workout, fundamentally altering the structure of the session.

Conclusion
This benchmark shows a consistent and meaningful difference. Across 50 independently validated sessions, Vekta detected nearly all intervals performed. TrainingPeaks frequently did not. That difference matters.
For athletes, it means the work you complete is recognised properly. Efforts are not missed. Sessions are not misrepresented. The story of your training reflects what actually happened.
For coaches, it means analysis is built on accurate structure. Intervals are not merged, fragmented, or lost. Session intent remains intact. Planning and feedback are based on reality, not approximation.
For teams and performance staff, it ensures workload modelling, intensity distribution, and performance analysis are grounded in reliable session structure. When decisions are made on marginal gains, foundational accuracy matters.
Automatic interval detection plays an increasingly important role in how training sessions are interpreted. When that layer is unreliable, small inaccuracies can compound over time. They influence how sessions are evaluated, how progress is judged, and how future decisions are made.
This benchmark does not argue preference. It measures accuracy.
And in this controlled comparison, Vekta delivered materially higher detection accuracy across structured, variable, and unstructured training. When the foundation is accurate, everything built on top of it becomes more dependable
Automatic Interval Detection Comparison:
Vekta vs TrainingPeaks
Published: Q1 2026
Summary
In this controlled 50-session benchmark, Vekta demonstrated significantly higher automatic interval detection accuracy than TrainingPeaks across all structural formats.
50 identical cycling sessions were processed on Vekta and TrainingPeaks.
All sessions were independently validated by two data scientists to establish verified interval counts.
Mean detection accuracy was 97.54% on Vekta compared with 48.24% on TrainingPeaks.
Perfect interval detection occurred in 43 of 50 sessions on Vekta and 9 of 50 sessions on TrainingPeaks.
24 sessions fell below 50% accuracy on TrainingPeaks. None did on Vekta.
On average, Vekta misidentified 0.26 intervals per session, compared with 6.06 intervals per session on TrainingPeaks.
Automatic interval detection is becoming foundational to endurance analysis. This benchmark evaluates how two fundamentally different implementations perform under identical, controlled conditions.
Introduction
For years, analysing structured training required manual work. Coaches and athletes reviewed power files, identified intervals, and interpreted the structure and data of a session themselves.
Automatic interval detection changes that. Instead of manually defining intervals, platforms now interpret raw power files and automatically identify meaningful blocks. When implemented correctly, it reduces workload and increases consistency. When implemented poorly, it silently distorts the analytical foundation of a session.
At Vekta, we introduced automatic interval detection to endurance world. Recently, TrainingPeaks launched its own implementation. As adoption expands across platforms, benchmarking quality becomes essential.
This study evaluates how the two systems perform under identical conditions.
To assess this directly, we conducted a controlled side-by-side comparison between Vekta and TrainingPeaks. Fifty identical cycling sessions were analysed using the same raw files, independently validated with no manual intervention.
All interval counts were validated by two data scientists prior to scoring.
Why Interval Detection Is Foundational
Automatic interval detection is not simply a visual feature. At Vekta it is the entry point to the analytical model.
Every detected interval feeds directly into intensity classification relative to Critical Power, distribution of work across physiological domains, identification of the dominant training stimulus, and session-level modelling that supports long-term load tracking and performance analysis.
Detection is therefore the first layer in a multi-layer analytical stack.
If detection is inaccurate, intensity classification becomes distorted, stimulus assignment shifts, and session summaries misrepresent the physiological demand of the workout. Over time those errors compound, affecting aggregated workload metrics and long-term performance modelling.
Detection accuracy is therefore not just about visual segmentation. It determines whether the analytical model reflects the training session that actually occurred.
Architectural Differences in Detection Logic
The difference in detection accuracy begins with how each system identifies intervals. At Vekta, interval detection is built around a machine learning model, while TrainingPeaks relies on rule-based thresholds.
TrainingPeaks: Rule-Based Interval Detection
TrainingPeaks detects intervals using a fixed 7-zone power model with predefined duration thresholds. Only efforts above Zone 3 are eligible for detection, and intervals are triggered once a specific intensity–duration rule is satisfied. This approach works well when efforts are clearly separated and power remains relatively stable throughout the interval.
However, real training sessions are rarely that clean. In practice, sessions often include:
Sub-threshold work blocks
Tightly spaced intervals
Progressive threshold builds
Mixed-intensity sets
Variable cadence efforts
Irregular work-recovery transitions
When detection relies strictly on fixed statistical thresholds, these variations can cause intervals to be fragmented, merged, or missed entirely.
Vekta: Pattern-Based Detection Using Machine Learning
Vekta approaches interval detection differently. Instead of relying solely on fixed zone triggers, Vekta uses a machine learning model trained on real training sessions. The model evaluates patterns of effort relative to an athlete’s Critical Power and interprets transitions between work and recovery across the entire session.
Rather than simply asking whether power exceeds a threshold for a set period of time, the system analyses how effort evolves over the course of the workout.
As training sessions become more complex, these architectural differences have a significant impact on detection accuracy.
Detection Model Comparison
Detection Dimension | Vekta | TrainingPeaks |
|---|---|---|
Detection Logic | Dynamic interpretation relative to CP | Fixed 7-zone trigger rules |
Algorithm Type | Machine learning model trained on real sessions | Rule-based statistical thresholds |
Minimum Duration Rules | Adaptive | Fixed per zone |
Sub-Zone 3 Detection | Included where structurally meaningful | Not detected |
Structural Interpretation | Pattern-based | Trigger-based intensity gating |
Methodology
50 structured cycling sessions
Same raw power files processed independently on both platforms
No manual correction applied
Verified ground truth interval counts established prior to testing
Both platforms evaluated using default automatic detection logic
Overall Detection Accuracy: Vekta vs TrainingPeaks
Summary Metrics
Metric | Vekta | TrainingPeaks |
|---|---|---|
Mean Accuracy | 97.54% | 48.24% |
Median Accuracy | 100% | 55% |
Perfect Sessions | 43 | 9 |
Sessions <80% | 3 | 35 |
Sessions <50% | 0 | 24 |
The separation is material and consistent across the dataset. The median session on Vekta achieved full interval detection. The median session on TrainingPeaks detected just over half of the validated intervals.
In 86% of sessions, Vekta achieved perfect detection. TrainingPeaks achieved perfect detection in only 18% of sessions. This reflects a structural difference in how the two systems detect intervals, not isolated anomalies.
Median accuracy provides a more representative view of typical performance.
A median of 55% means half of sessions are above this value and half below. Unlike the mean, the median is not significantly influenced by extreme values, making it a more stable indicator when performance varies across different session types.
Accuracy Distribution
Accuracy Band | Vekta | TrainingPeaks |
|---|---|---|
100% | 43 | 9 |
90–99% | 1 | 2 |
80–89% | 2 | 4 |
50–79% | 3 | 11 |
<50% | 1 | 24 |
Vekta’s results are tightly clustered at full detection. TrainingPeaks exhibits wide spread and frequent cases of severe under-detection
Detection Accuracy by Session Format
To understand how session structure affects interval detection, workouts were grouped into three formats:
Structured – Clean
Intervals where power remains relatively stable throughout each effort.
Structured – Variable
Intervals where power fluctuates within the effort, such as over/unders or variable climbing intervals.
Mixed / Unstructured
Sessions with irregular effort patterns such as fartlek or non-uniform interval structures.
Session Format | Sessions | Vekta Mean | TrainingPeaks Mean | TP Sessions <50% |
|---|---|---|---|---|
Structured – Clean | 18 | 99.61% | 62.44% | 5 |
Structured – Variable | 12 | 99.33% | 35.92% | 7 |
Mixed / Unstructured | 20 | 94.30% | 46.40% | 12 |
TrainingPeaks performs best in Structured – Clean sessions, where intervals are clearly separated and power remains relatively steady.
As session structure becomes more variable, detection accuracy drops sharply. In Structured – Variable sessions, mean accuracy falls to 35.92%, with many intervals missed entirely.
Performance remains inconsistent in Mixed / Unstructured sessions, where irregular effort patterns make threshold-based detection more difficult.
Vekta, by contrast, maintains consistently high detection accuracy across all session formats.
Detection Accuracy by Interval Duration
Interval duration also influences detection difficulty. Very short maximal efforts tend to exceed power thresholds clearly, while longer intervals often contain power variability that makes them harder for rule-based systems to interpret.
Interval Type | Sessions | Vekta Mean | TrainingPeaks Mean |
|---|---|---|---|
Sprint (~10–20s) | 8 | 94.38% | 79.88% |
Short (30s–1min) | 16 | 98.75% | 55.81% |
Long (>2min) | 26 | 97.77% | 33.85% |
TrainingPeaks performs relatively well on very short maximal efforts. However, detection accuracy drops sharply for longer intervals where power variability within the effort becomes more significant. More complex interval structures such as over/unders or long threshold efforts are therefore harder for rule-based systems to interpret reliably.
Vekta maintains consistently high detection accuracy across all interval durations.
Visual Examples: How Detection Behaviour Differs in Practice
The statistical benchmark above shows a consistent difference in detection accuracy between the two systems. Looking at individual sessions helps illustrate how those differences appear in practice.
Example 1: Multiple Intervals Detected as a Single Effort
In this session, four separate work intervals were performed.
Vekta correctly identifies each interval as an independent effort block. TrainingPeaks instead interprets the entire sequence as a single interval. This occurs because the detection logic relies on threshold triggers and does not interpret the structure of the repeated effort pattern.
Vekta correctly detects 4 intervals.
TrainingPeaks interprets the sequence as a single interval.
Example 2: Fragmented Detection of a Sustained Interval
In this session, a sustained threshold effort was performed.
Vekta detects the effort as a single continuous interval. TrainingPeaks fragments the same effort into multiple shorter intervals because short fluctuations in power trigger repeated threshold crossings.
Vekta detects 1 continuous interval.
TrainingPeaks fragments the effort into four intervals.
Example 3: Threshold Intervals Missed in a Mixed Session
This session contains a combination of sprint efforts followed by threshold work.
TrainingPeaks correctly identifies the short maximal sprints, where power clearly exceeds threshold triggers. However, the longer threshold intervals that follow are not detected.
Vekta identifies both the sprint efforts and the threshold intervals, preserving the full structure of the session.
TrainingPeaks detects the 6 sprints but none of the threshold intervals.
Absolute Interval Error
Absolute interval error represents the average number of intervals incorrectly detected in each session.
Metric | Vekta | TrainingPeaks |
|---|---|---|
Mean Absolute Error | 0.26 | 6.06 |
Max Absolute Error | 5 | 40 |
Zero Error Sessions | 43 | 9 |
On average, Vekta deviated by just 0.26 intervals per session, while TrainingPeaks deviated by 6.06 intervals per session.
In the most extreme case, TrainingPeaks misidentified 40 intervals within a single workout, fundamentally altering the structure of the session.
Conclusion
This benchmark shows a consistent and meaningful difference. Across 50 independently validated sessions, Vekta detected nearly all intervals performed. TrainingPeaks frequently did not. That difference matters.
For athletes, it means the work you complete is recognised properly. Efforts are not missed. Sessions are not misrepresented. The story of your training reflects what actually happened.
For coaches, it means analysis is built on accurate structure. Intervals are not merged, fragmented, or lost. Session intent remains intact. Planning and feedback are based on reality, not approximation.
For teams and performance staff, it ensures workload modelling, intensity distribution, and performance analysis are grounded in reliable session structure. When decisions are made on marginal gains, foundational accuracy matters.
Automatic interval detection plays an increasingly important role in how training sessions are interpreted. When that layer is unreliable, small inaccuracies can compound over time. They influence how sessions are evaluated, how progress is judged, and how future decisions are made.
This benchmark does not argue preference. It measures accuracy.
And in this controlled comparison, Vekta delivered materially higher detection accuracy across structured, variable, and unstructured training. When the foundation is accurate, everything built on top of it becomes more dependable
Frequently asked questions

Brand Director


Dream big with Vekta, the most advanced training and coaching platform.

Ce projet a été financé par la Région et/ou par l’État dans le cadre de France 2030
© 2026 — Copyright - GRAIG SAS
Dream big with Vekta, the most advanced training and coaching platform.
Ce projet a été financé par la Région et/ou par l’État dans le cadre de France 2030
© 2026 — Copyright - GRAIG SAS