
Race
Race
Race
6
6
6
min
min
min
Dominic Valerio
Dominic Valerio
Tour de France 2025: In Numbers
Tour de France 2025: In Numbers
The Tour de France doesn’t just reward the strongest rider.
It rewards the best-prepared system.
In 2025, performance at the highest level means more than just power output. It means understanding load, recovery, nutrition, strategy and being able to adapt in real time.
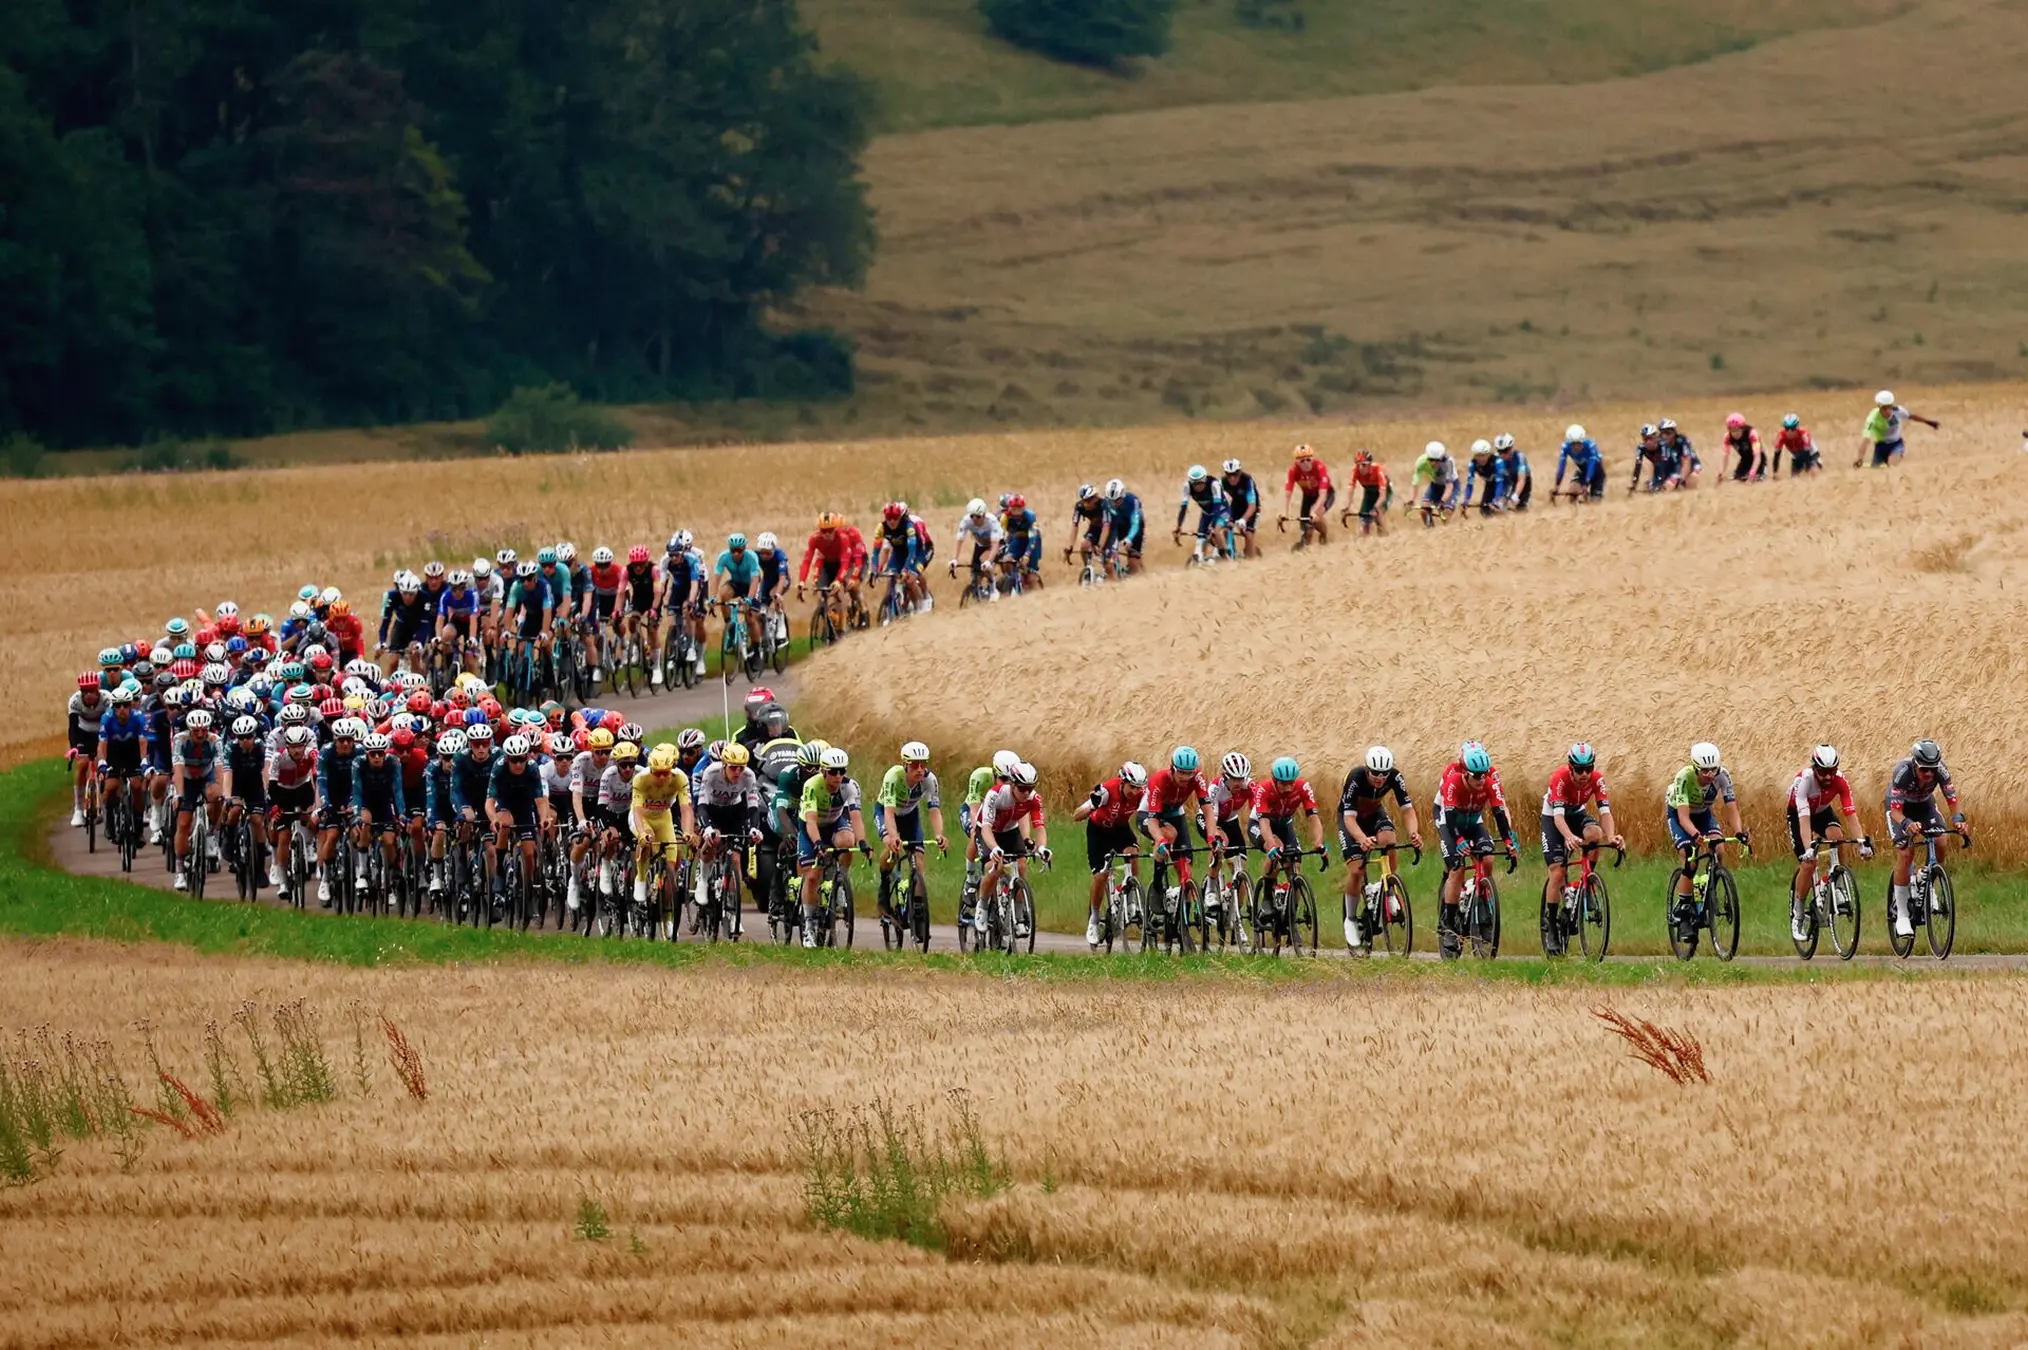
This year’s Tour spans 3,338km with over 51,550m of climbing. Across 21 stages, riders will be asked to execute perfectly, day after day, in one of the most tightly controlled and brutally competitive environments in sport.
Behind every winning move is a plan built on data. Behind every GC push is a team leveraging insight to make marginal gains matter.
Here’s what the race demands and where precision, planning, and performance systems like Vekta create real advantage.
3,338 km
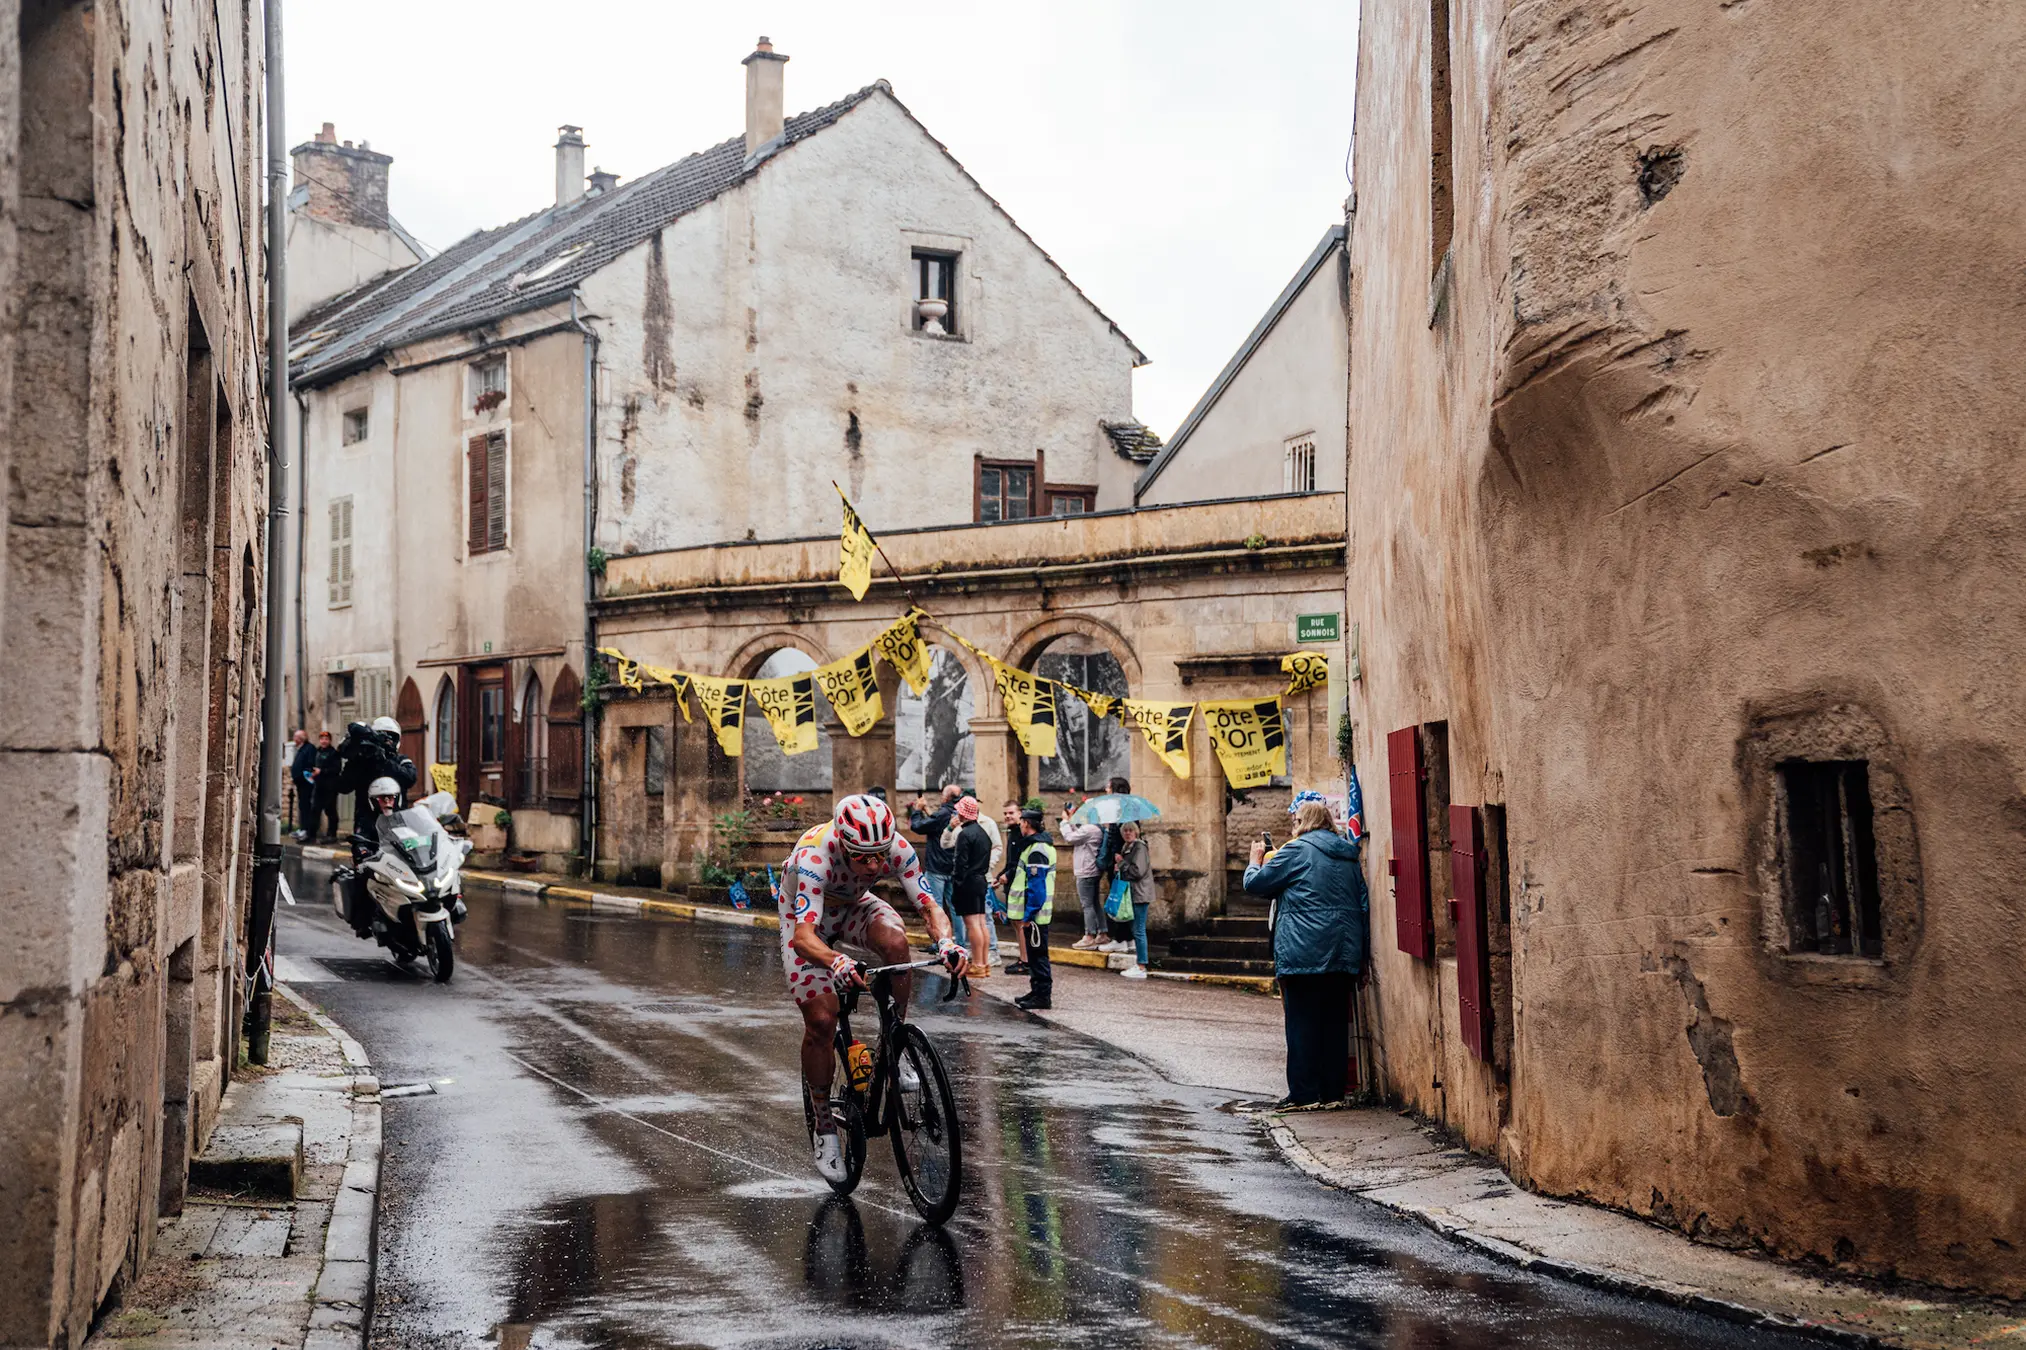
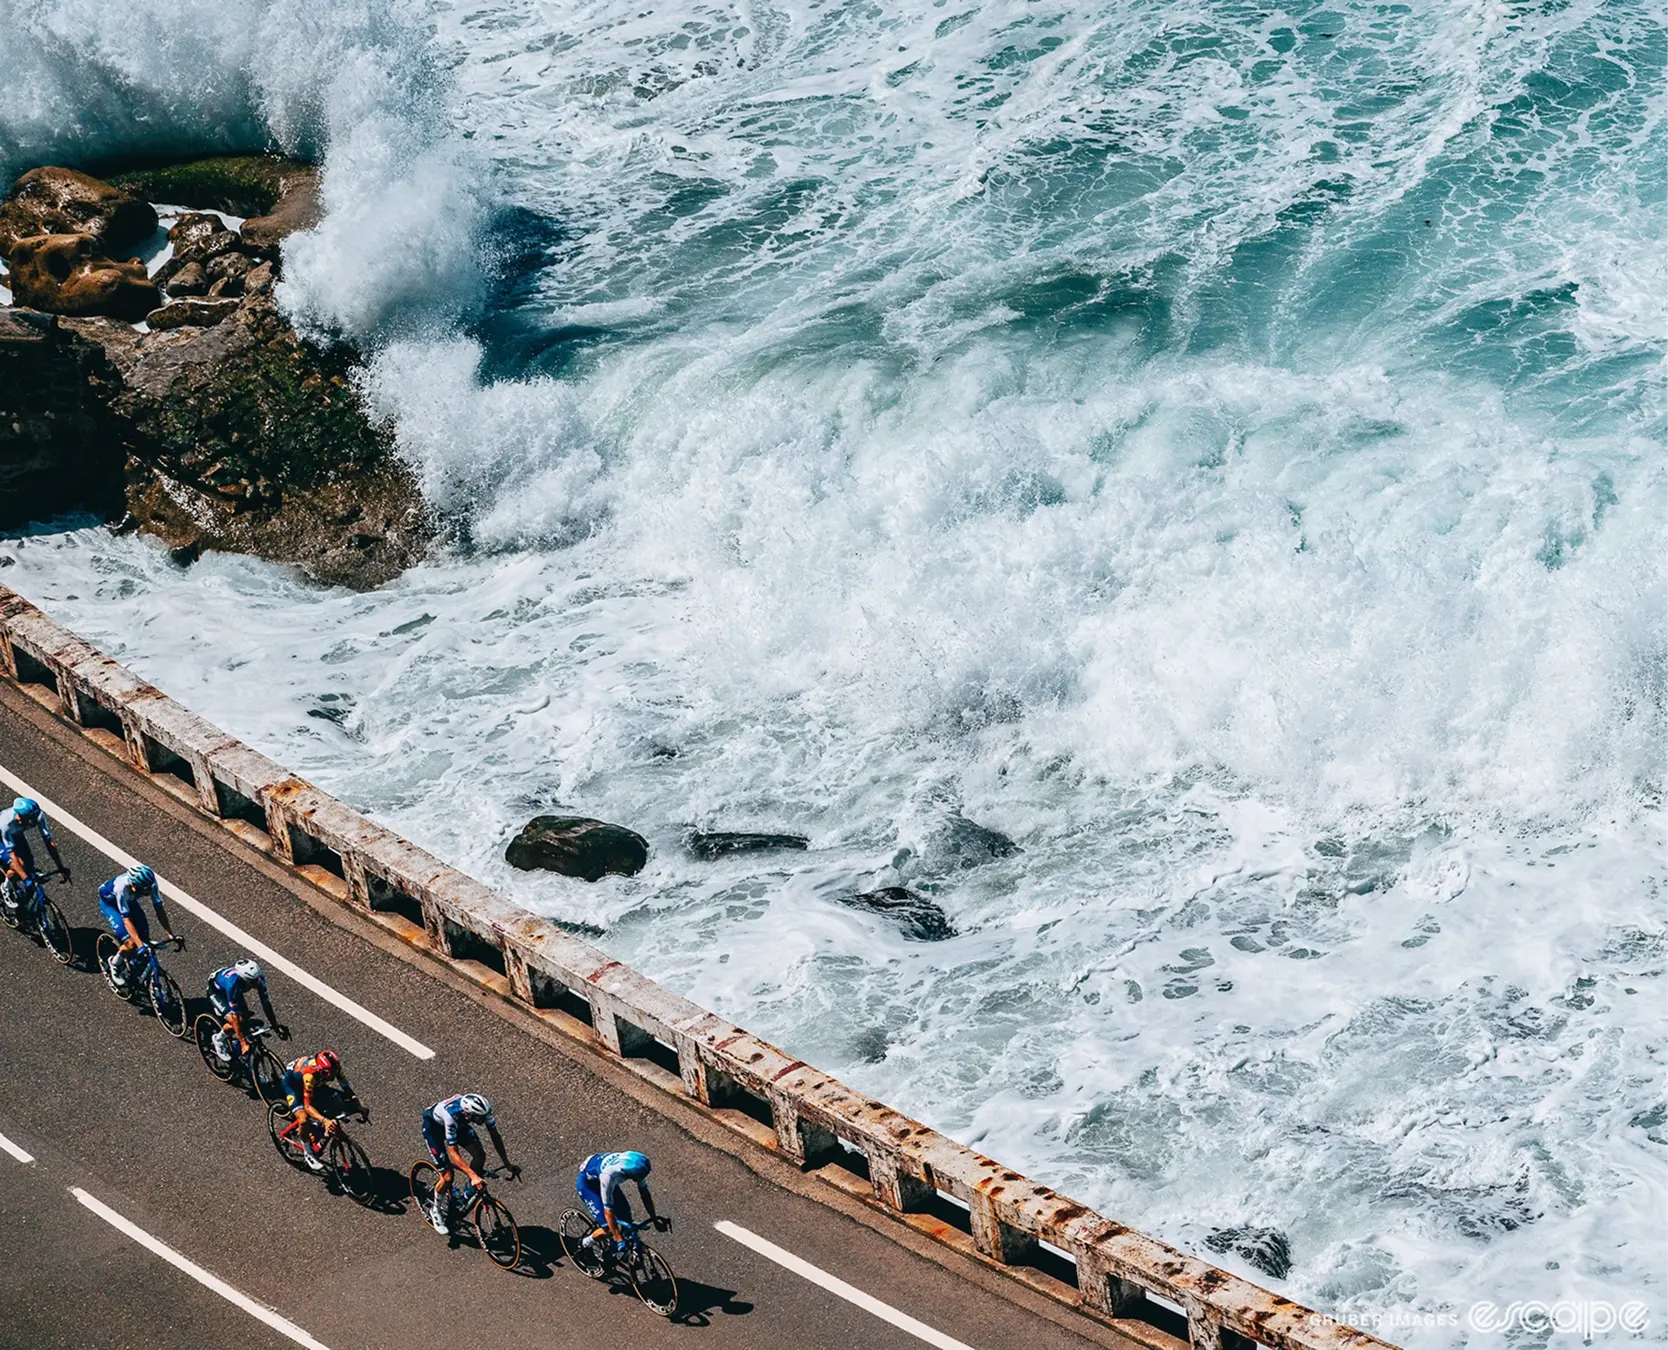
The full 2025 Tour route stretches from Lille in the north to the final stage on the Champs-Élysées in Paris. It's a mix of high mountains, technical descents, exposed coastlines, and long transitional stages, all contained within France, across 11 regions and 34 departments.

51,550 m of Elevation Gain
The total climbing load across the Tour — equivalent to ascending Mount Everest six times. These are not just numbers; they’re demands on glycogen, neuromuscular fatigue, and strategic pacing. Riders and coaches must calculate exactly how much effort can be given, and when.
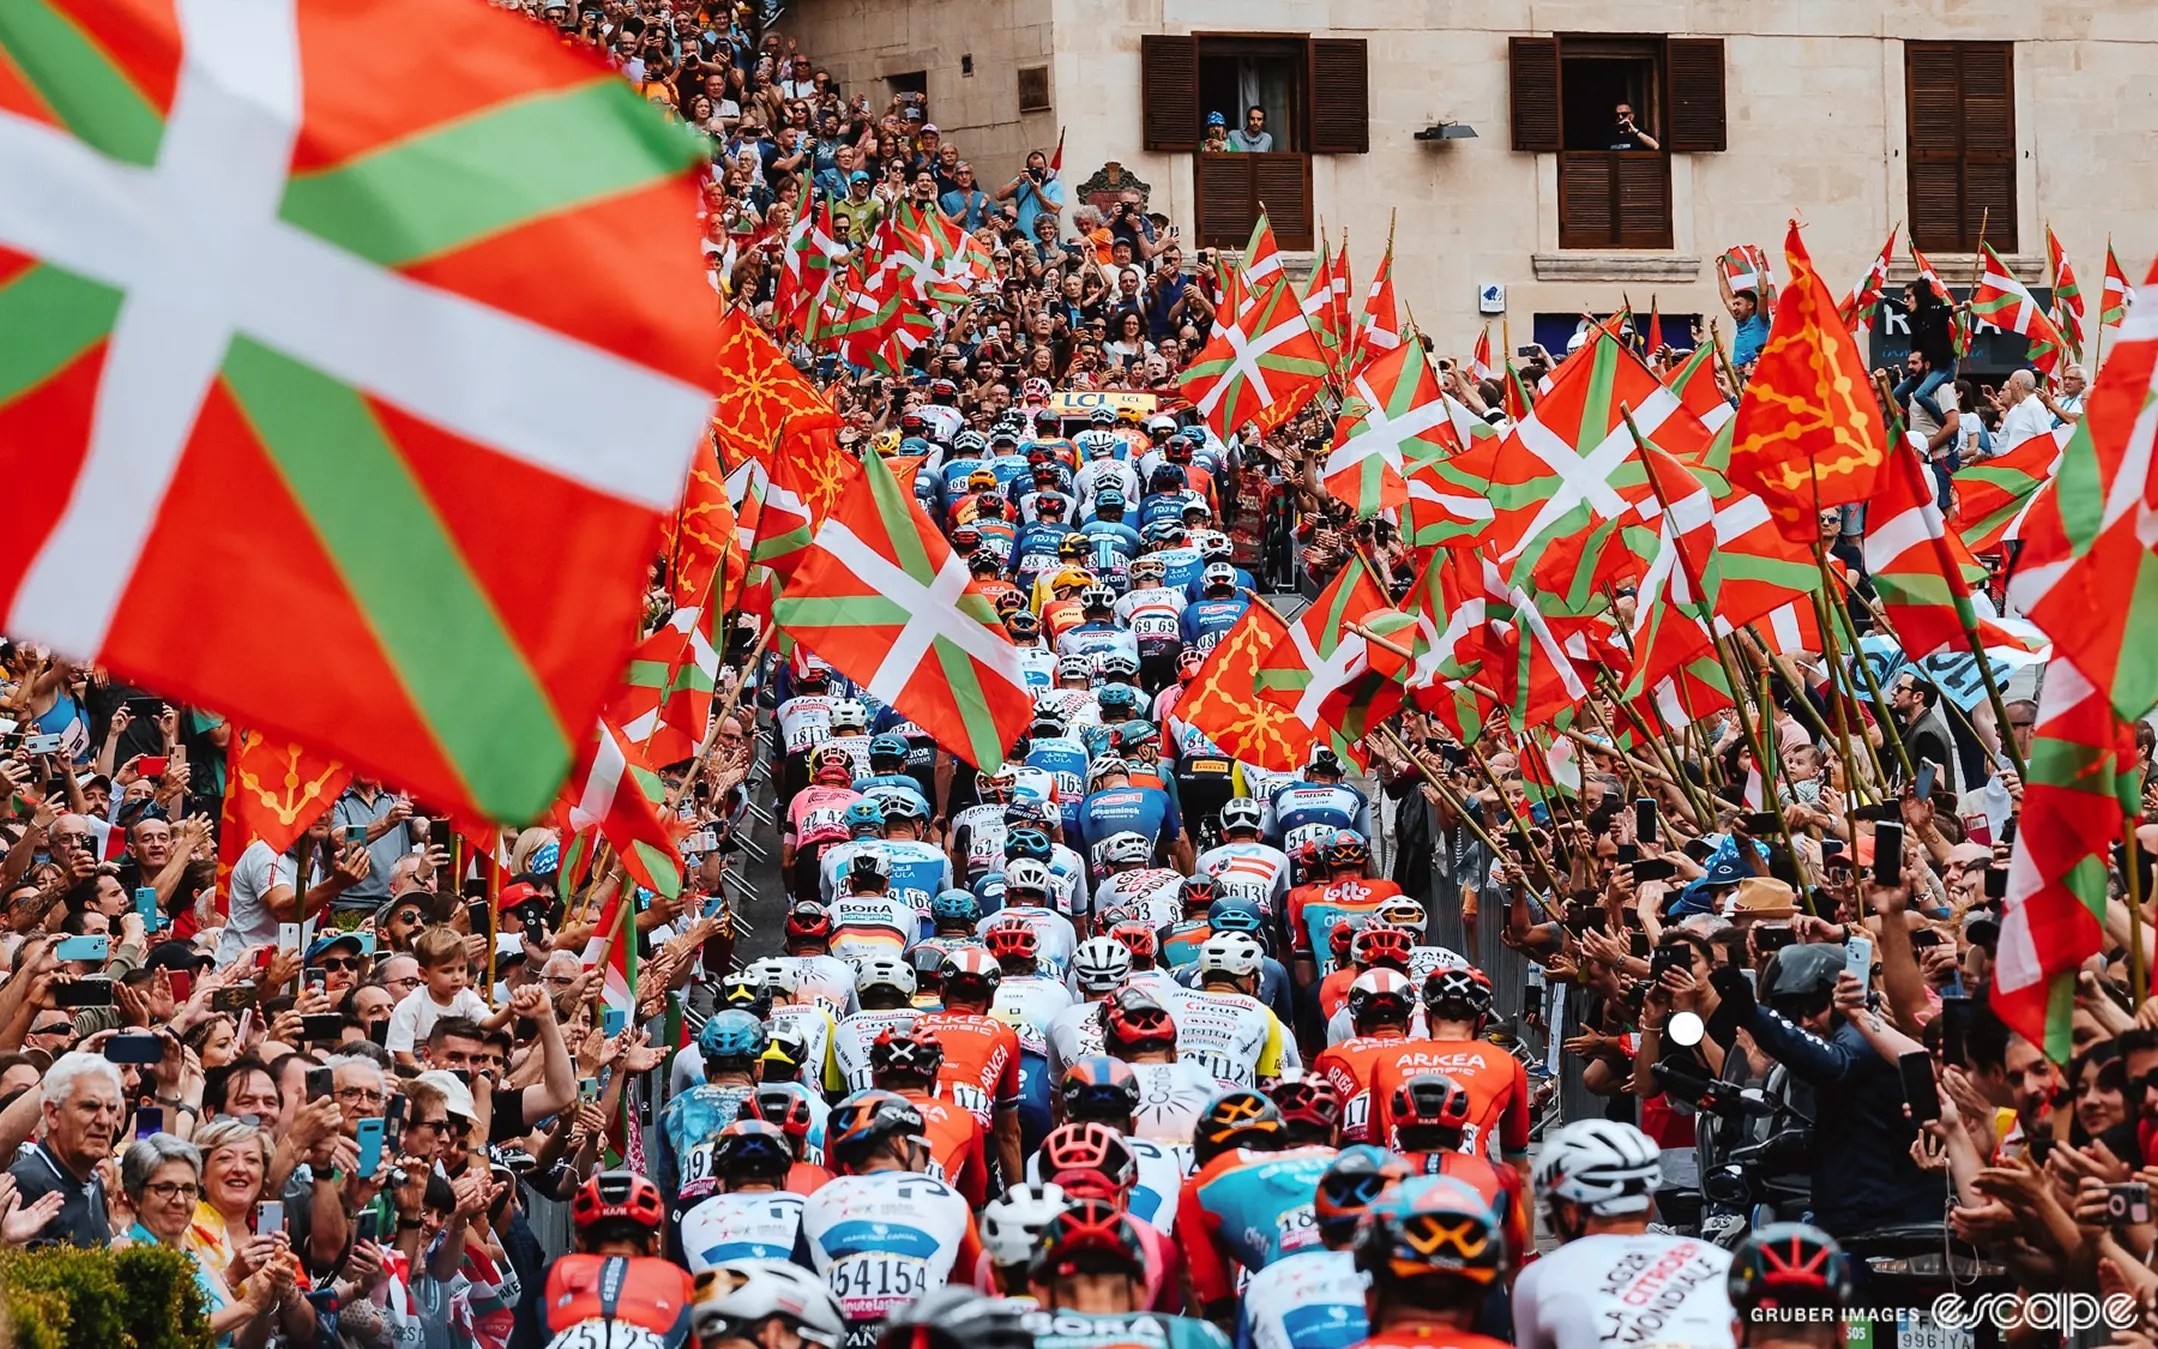
21 Stages
Raced entirely within France. This year’s route is strategically demanding, front-loaded with flat stages, but shaped by decisive climbs, summit finishes at altitude, and two time trials including a short but brutal uphill TT to Superdévoluy. Performance here is as much about smart distribution of intensity as it is about raw form.
2,304 m — Col de la Loze
The highest point of the Tour. This brutal climb returns as the centrepiece of a key Alpine stage. With gradients constantly shifting and altitude in play, this is where pacing errors become race-ending.
At over 2,300 metres, reduced oxygen availability increases physiological strain and limits power output. Athletes without a clear altitude adaptation plan, whether via training camps, heat protocols, or recovery adjustments, risk falling behind when it matters most.
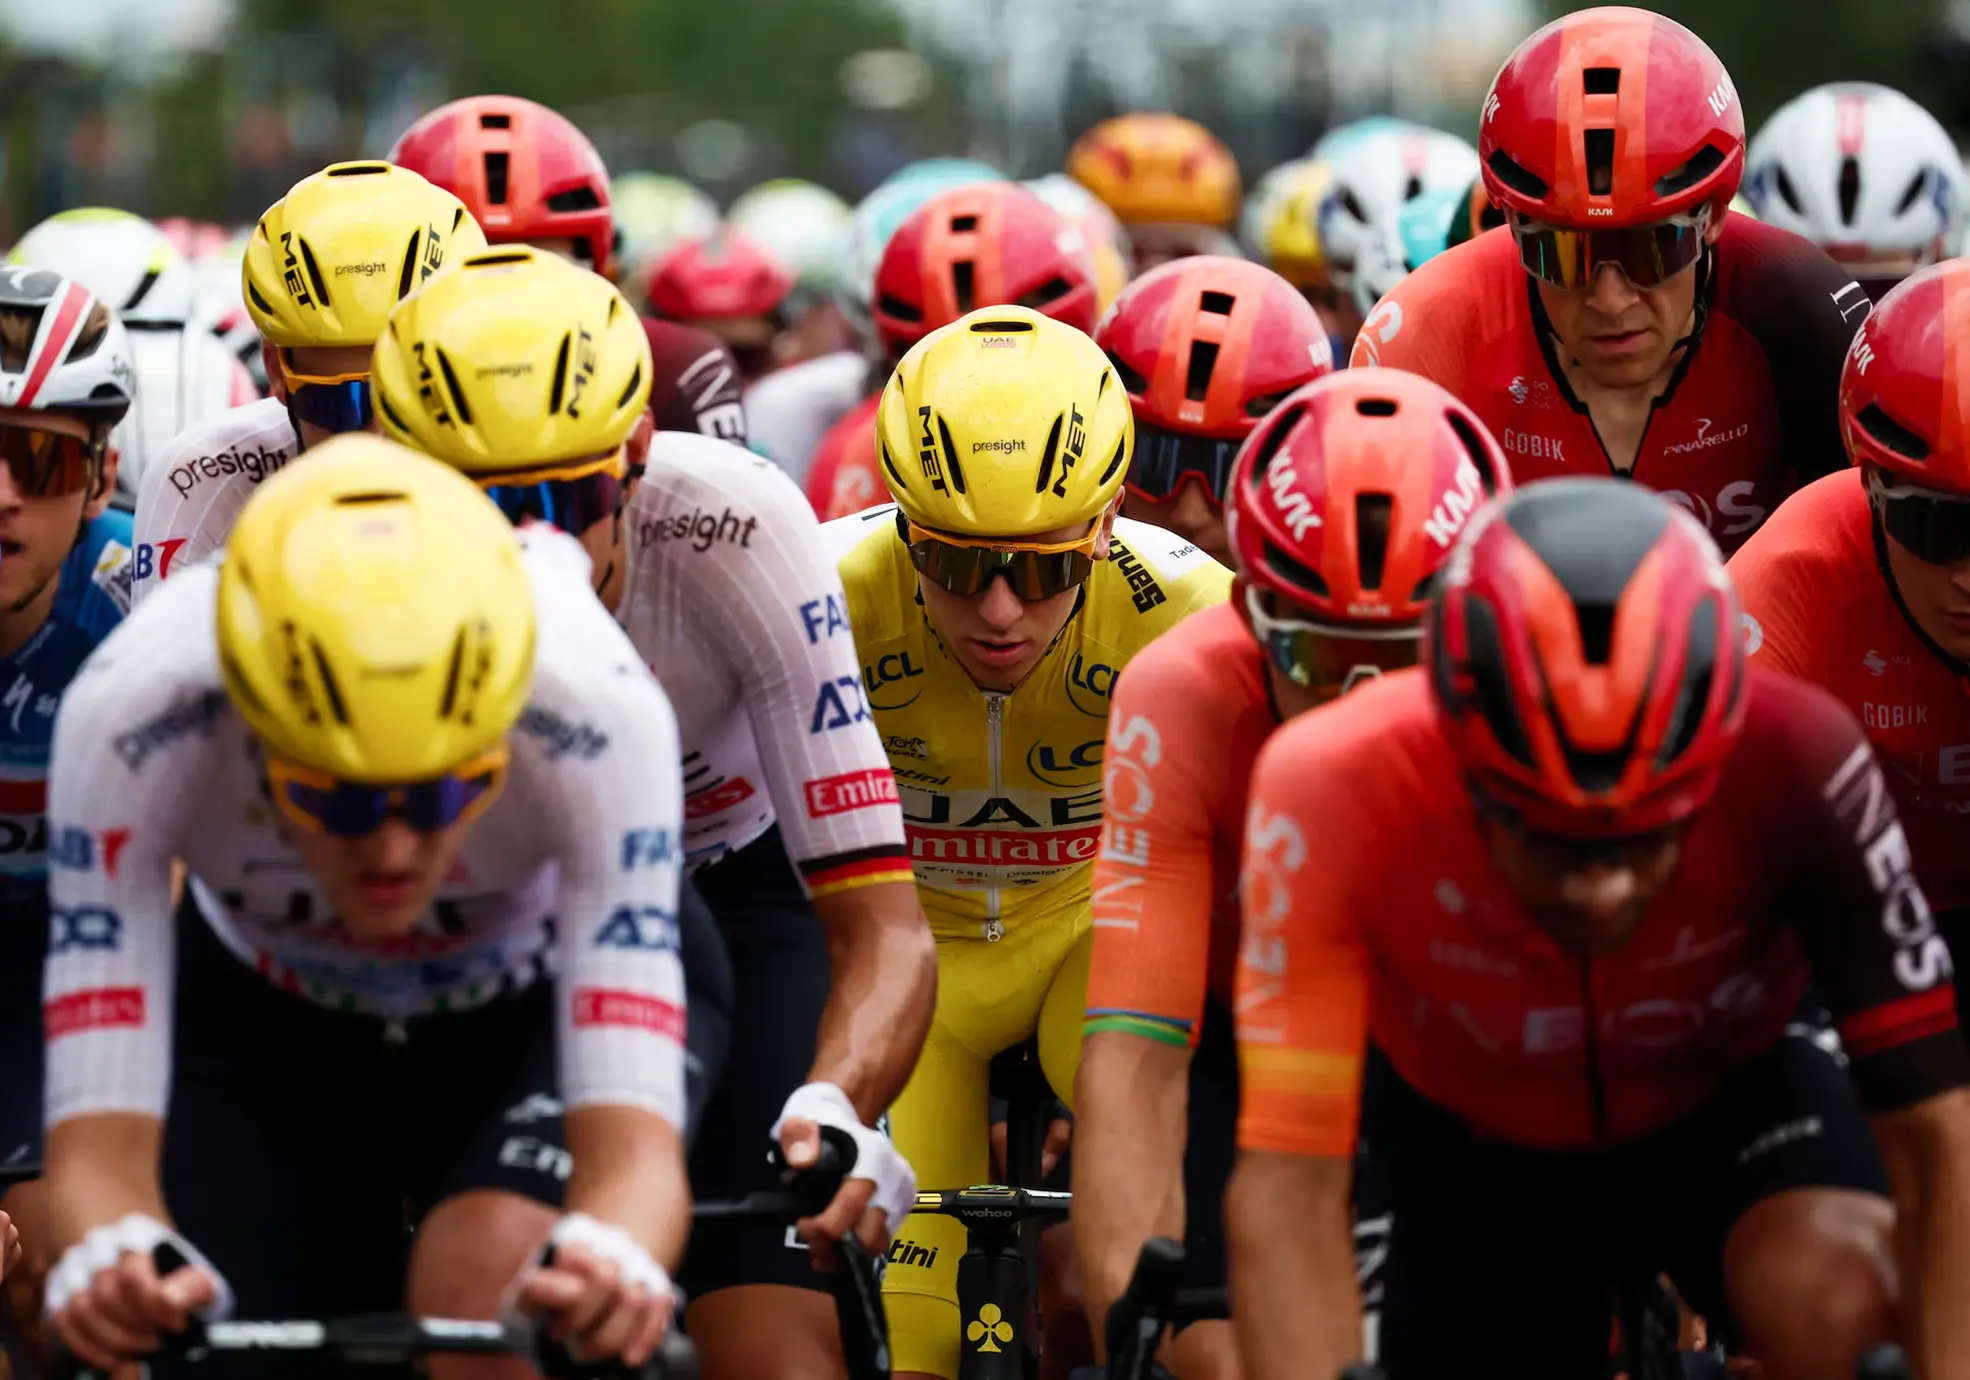
184 Riders
Twenty-three teams of eight. But by the final stage in Paris, the peloton will be smaller. Crashes, illness, heat, and fatigue will thin the ranks. The riders who finish strong are the ones with the best systems behind them.
212 km — Longest Stage
Stage 2 from Lauwin-Planque to Boulogne-sur-Mer is the longest of the race. Long, exposed, and built for speed, this is where early-season base work and energy management protocols show their value.
65,000 – 87,000 kJ
Estimated total energy expenditure per rider across the Tour. That’s an average of 3,000–4,000 kJ per stage. Managing glycogen, hydration, digestion, and absorption becomes a high-stakes science.
97,000 – 126,000 kcal
The full race energy demand per rider. Equivalent to around 420 slices of pizza — or over 6,000 kcal/day. This is where marginal gains in fuelling and gut tolerance become measurable performance differentiators.

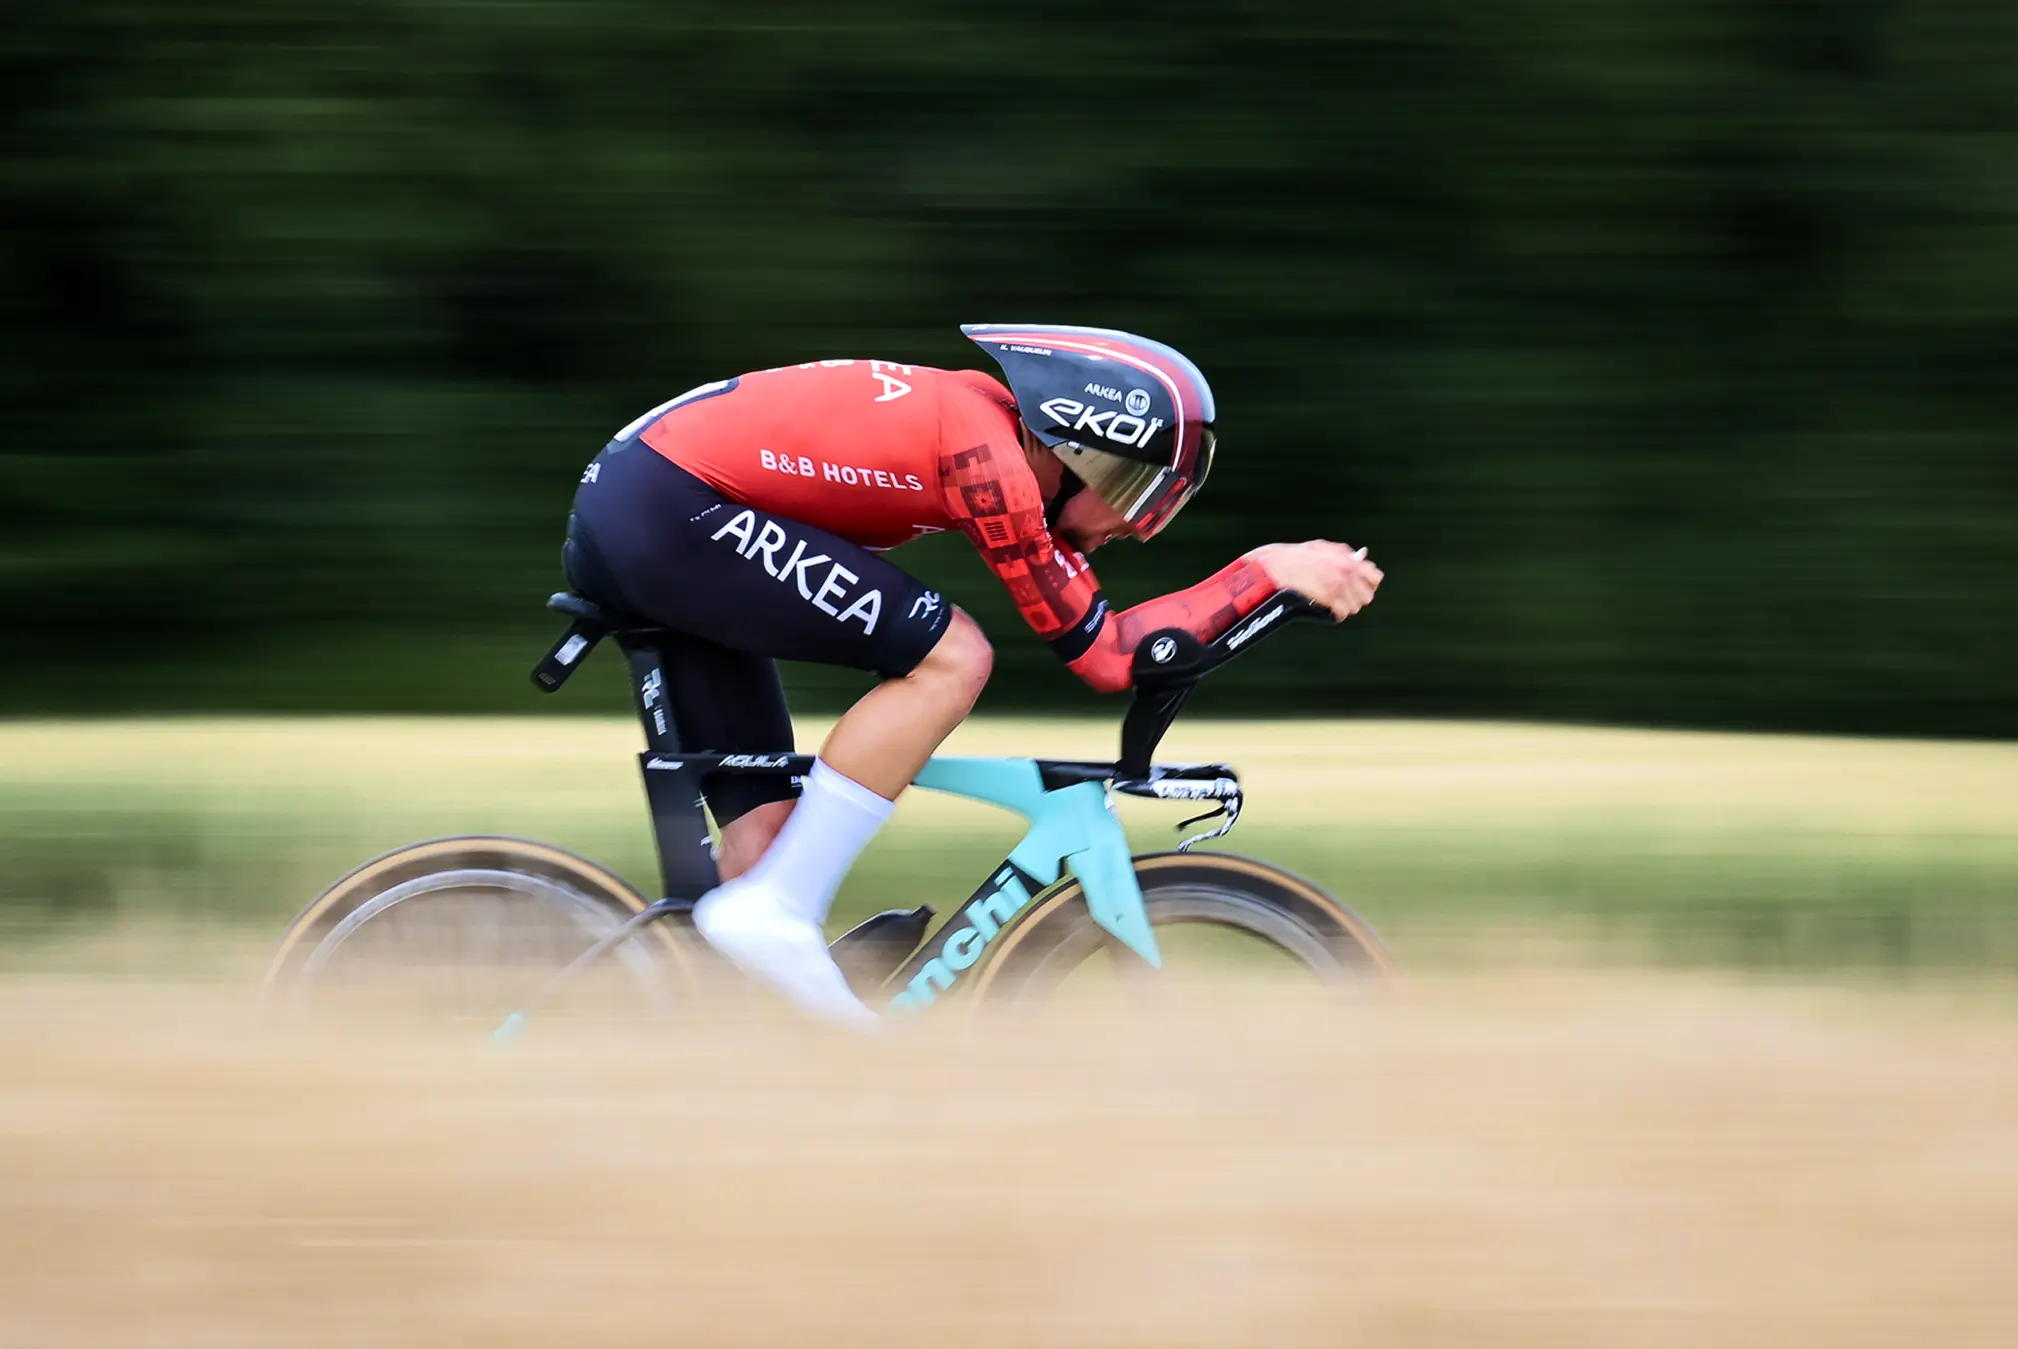
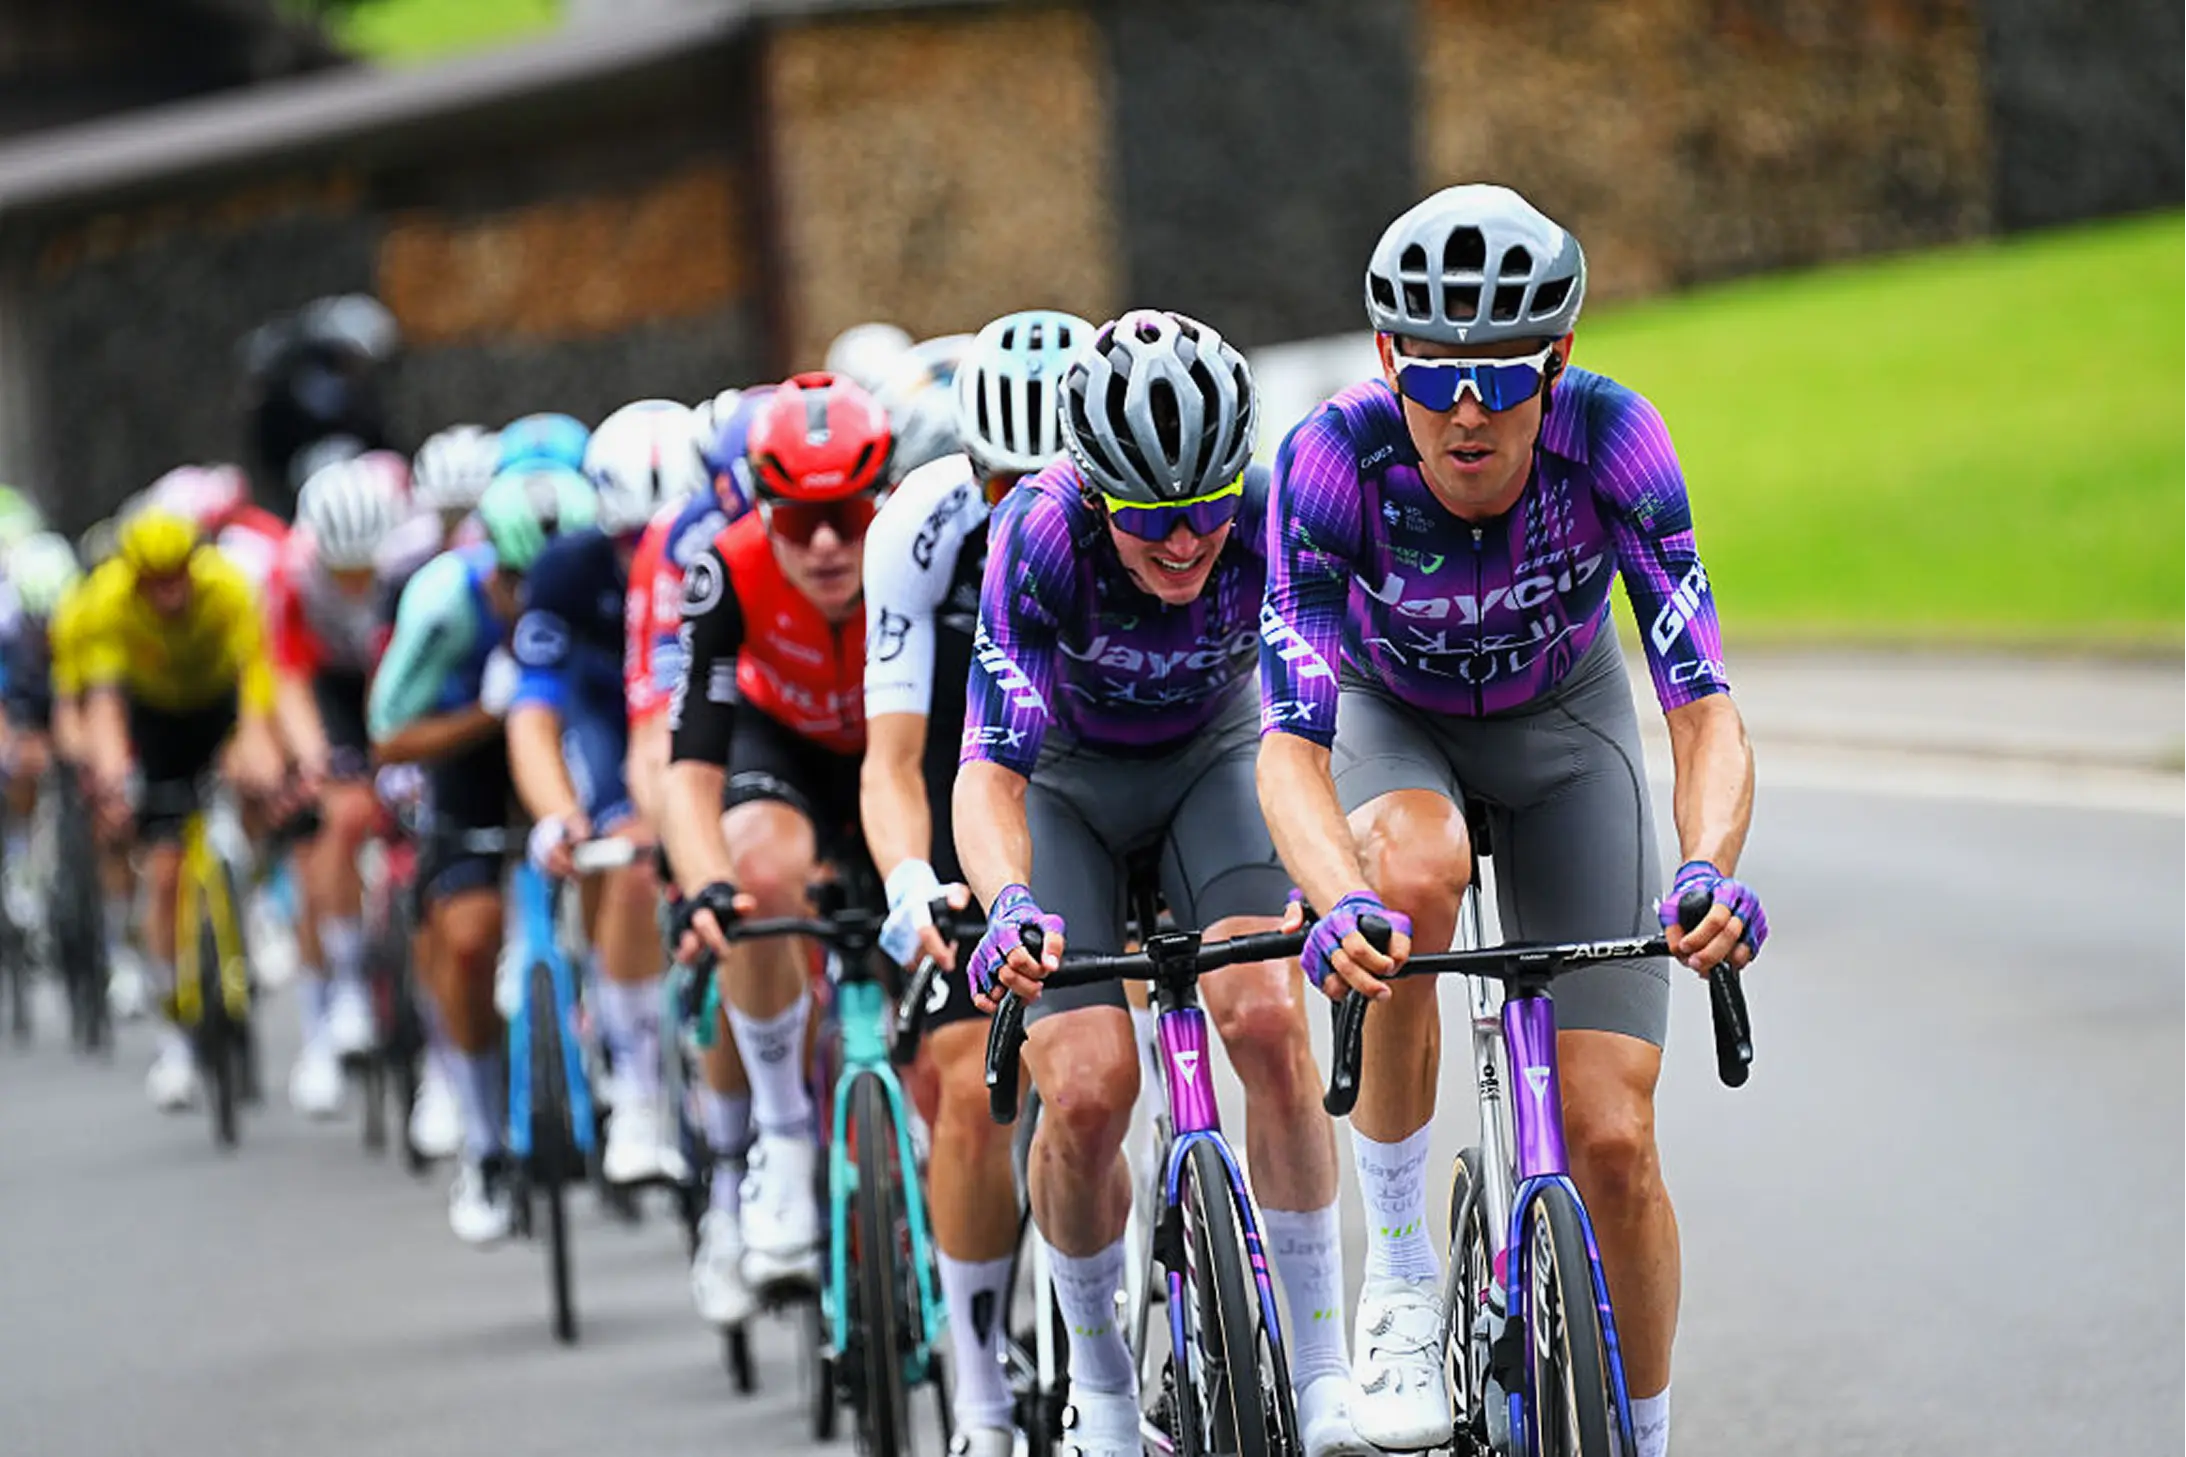
36
That’s how many riders and coaches Vekta is supporting at the 2025 Tour de France — from Team Jayco–AlUla and Arkéa–B&B Hotels. These are some of the most driven, data-literate athletes and coaches in the sport, using Vekta to optimise performance day by day, stage by stage.
The Tour de France isn’t won by chance. It’s won by those who know how to manage load, adapt in real time, and extract meaning from every data point.
At this level, insight doesn’t support performance, it drives it.
Unlock the same insights already powering athletes and coaches at the 2025 Tour de France.
Start your free 14-day trial or Book a Demo
The Tour de France doesn’t just reward the strongest rider.
It rewards the best-prepared system.
In 2025, performance at the highest level means more than just power output. It means understanding load, recovery, nutrition, strategy and being able to adapt in real time.
This year’s Tour spans 3,338km with over 51,550m of climbing. Across 21 stages, riders will be asked to execute perfectly, day after day, in one of the most tightly controlled and brutally competitive environments in sport.
Behind every winning move is a plan built on data. Behind every GC push is a team leveraging insight to make marginal gains matter.
Here’s what the race demands and where precision, planning, and performance systems like Vekta create real advantage.
3,338 km
The full 2025 Tour route stretches from Lille in the north to the final stage on the Champs-Élysées in Paris. It's a mix of high mountains, technical descents, exposed coastlines, and long transitional stages, all contained within France, across 11 regions and 34 departments.
51,550 m of Elevation Gain
The total climbing load across the Tour — equivalent to ascending Mount Everest six times. These are not just numbers; they’re demands on glycogen, neuromuscular fatigue, and strategic pacing. Riders and coaches must calculate exactly how much effort can be given, and when.
21 Stages
Raced entirely within France. This year’s route is strategically demanding, front-loaded with flat stages, but shaped by decisive climbs, summit finishes at altitude, and two time trials including a short but brutal uphill TT to Superdévoluy. Performance here is as much about smart distribution of intensity as it is about raw form.
2,304 m — Col de la Loze
The highest point of the Tour. This brutal climb returns as the centrepiece of a key Alpine stage. With gradients constantly shifting and altitude in play, this is where pacing errors become race-ending.
At over 2,300 metres, reduced oxygen availability increases physiological strain and limits power output. Athletes without a clear altitude adaptation plan, whether via training camps, heat protocols, or recovery adjustments, risk falling behind when it matters most.
184 Riders
Twenty-three teams of eight. But by the final stage in Paris, the peloton will be smaller. Crashes, illness, heat, and fatigue will thin the ranks. The riders who finish strong are the ones with the best systems behind them.
212 km — Longest Stage
Stage 2 from Lauwin-Planque to Boulogne-sur-Mer is the longest of the race. Long, exposed, and built for speed, this is where early-season base work and energy management protocols show their value.
65,000 – 87,000 kJ
Estimated total energy expenditure per rider across the Tour. That’s an average of 3,000–4,000 kJ per stage. Managing glycogen, hydration, digestion, and absorption becomes a high-stakes science.
97,000 – 126,000 kcal
The full race energy demand per rider. Equivalent to around 420 slices of pizza — or over 6,000 kcal/day. This is where marginal gains in fuelling and gut tolerance become measurable performance differentiators.
36
That’s how many riders and coaches Vekta is supporting at the 2025 Tour de France — from Team Jayco–AlUla and Arkéa–B&B Hotels. These are some of the most driven, data-literate athletes and coaches in the sport, using Vekta to optimise performance day by day, stage by stage.
The Tour de France isn’t won by chance. It’s won by those who know how to manage load, adapt in real time, and extract meaning from every data point.
At this level, insight doesn’t support performance, it drives it.
Unlock the same insights already powering athletes and coaches at the 2025 Tour de France.
Start your free 14-day trial or Book a Demo

Brand Director
Top 5 Features of the Vekta Coaching Platform


Introducing Joe Staunton: Vekta’s Newest Coaching Partner

Dream big with Vekta, the most advanced training and coaching platform.

Ce projet a été financé par la Région et/ou par l’État dans le cadre de France 2030
© 2026 — Copyright - GRAIG SAS
Dream big with Vekta, the most advanced training and coaching platform.
Ce projet a été financé par la Région et/ou par l’État dans le cadre de France 2030
© 2026 — Copyright - GRAIG SAS