
Performance Science
Performance Science
Performance Science
12
12
12
min
min
min
Fabien Rabeau
Fabien Rabeau
The Influence of Exercise Intensity on Training Load with Fabien Rabeau
The Influence of Exercise Intensity on Training Load with Fabien Rabeau
In cycling, understanding the true cost of training goes beyond measuring the work performed. While kilojoules (kJ) remain a key indicator of external load, they don’t capture how intensity changes the physiological demand of a session.
In this piece, Fabien Rabeau, Head of Performance at ARKÉA B&B Hotels, examines how exercise intensity shapes the relationship between energy expenditure and internal load, and how Vekta’s Volume and Intensity framework offers a more complete view of training stress and adaptation. Vekta Volume and Intensity underpin how training load is interpreted within the platform.
Introduction
In professional cycling, accurately quantifying training load is essential for balancing stimulus and recovery. Traditionally, kilojoules (kJ), derived from power output, have offered a simple measure of external work. However, the true physiological and perceptual cost of a session is not determined by energy expenditure alone. Factors such as intensity, power distribution, and metabolic stress influence how demanding a session feels and how much strain it imposes internally.
With the advent of Vekta’s Volume & Intensity paradigm, we now have a more complete two-dimensional view of training: how much work was done (Volume) and how hard it was (Intensity). This article explores how exercise intensity shapes the relationship between kilojoules and internal load metrics, such as session RPE (sRPE) and time-in-zone, and what that means for understanding training stress in professional cycling.

Kilojoules as a Measure of External Load
Kilojoules (kJ) represent the mechanical energy a rider produces through power output. In long, steady sessions at moderate intensity, kJ scale almost linearly with duration, making them a practical indicator of total external work. However, kJ alone miss key aspects of training demand.
• Two sessions with identical kJ can create very different internal stress depending on whether they’re performed below or above threshold.
• kJ do not reflect neuromuscular fatigue, metabolic strain per minute, or the overall “hardness” of the effort.
As a result, kJ provide a dependable measure of total work done but remain an incomplete predictor of recovery needs or adaptive stimulus.
The Role of Intensity in Modulating kJ–Load Relationships
Intensity fundamentally shapes how kilojoules relate to the internal consequences of training.
• Low-Intensity, High-Volume (Zone 1–2): You can accumulate high kJ with relatively low internal strain. The cost per kJ is modest.
• Threshold or Supra-Threshold Work (Zones 3–6): Even moderate kJ expenditure in these zones can create a disproportionately high metabolic, neuromuscular, and perceptual load.
• High-Intensity Intervals: Sessions with modest kJ but concentrated high-intensity efforts often produce a high level of internal stress, showing how energy output and physiological cost can become uncoupled.
In Vekta’s framework, this uncoupling is exactly what the Intensity metric is designed to capture. It gives greater weight to efforts above Critical Power (CP) while remaining independent of session duration.
Comparative Training Load Metrics (Under a Vekta Lens)
In a Vekta-centric model, kilojoules (kJ) are not treated as the primary measure of training load but as one axis, Volume, within a two-dimensional system. Below is how traditional metrics compare and interact within that framework.
1. Vekta Volume and Intensity
• Vekta Volume quantifies total session demand, adjusted for rate of work and normalised by body weight.
• Vekta Intensity captures how hard a session was by continuously assessing local intensity and giving greater weight to efforts above Critical Power (CP). It also factors in W′, Pmax, fatigue accumulation, and environmental conditions such as altitude.
Together, these two metrics separate “how much” work was done from “how difficult” it was. This is similar to distinguishing distance from gradient.
A session with modest Volume but very high Intensity, for example short VO₂max intervals, differs meaningfully from a long, steady ride with low Intensity.
2. Session RPE (sRPE)
• Definition: The athlete’s subjective rating of session difficulty (e.g. 1–10), multiplied by duration.
• Relation to kJ: In steady, sub-threshold work, sRPE tends to correlate moderately with kJ and with Vekta Volume.
• Divergence under intensity: In high-stress conditions such as heat, altitude, or fatigue, sRPE can be elevated even when kJ are moderate. High-intensity efforts often increase sRPE, aligning more closely with Vekta Intensity.
sRPE remains a valuable internal feedback tool. Within the Vekta framework, it often correlates better with Intensity than with Volume, particularly in sessions that include significant supra-threshold work.
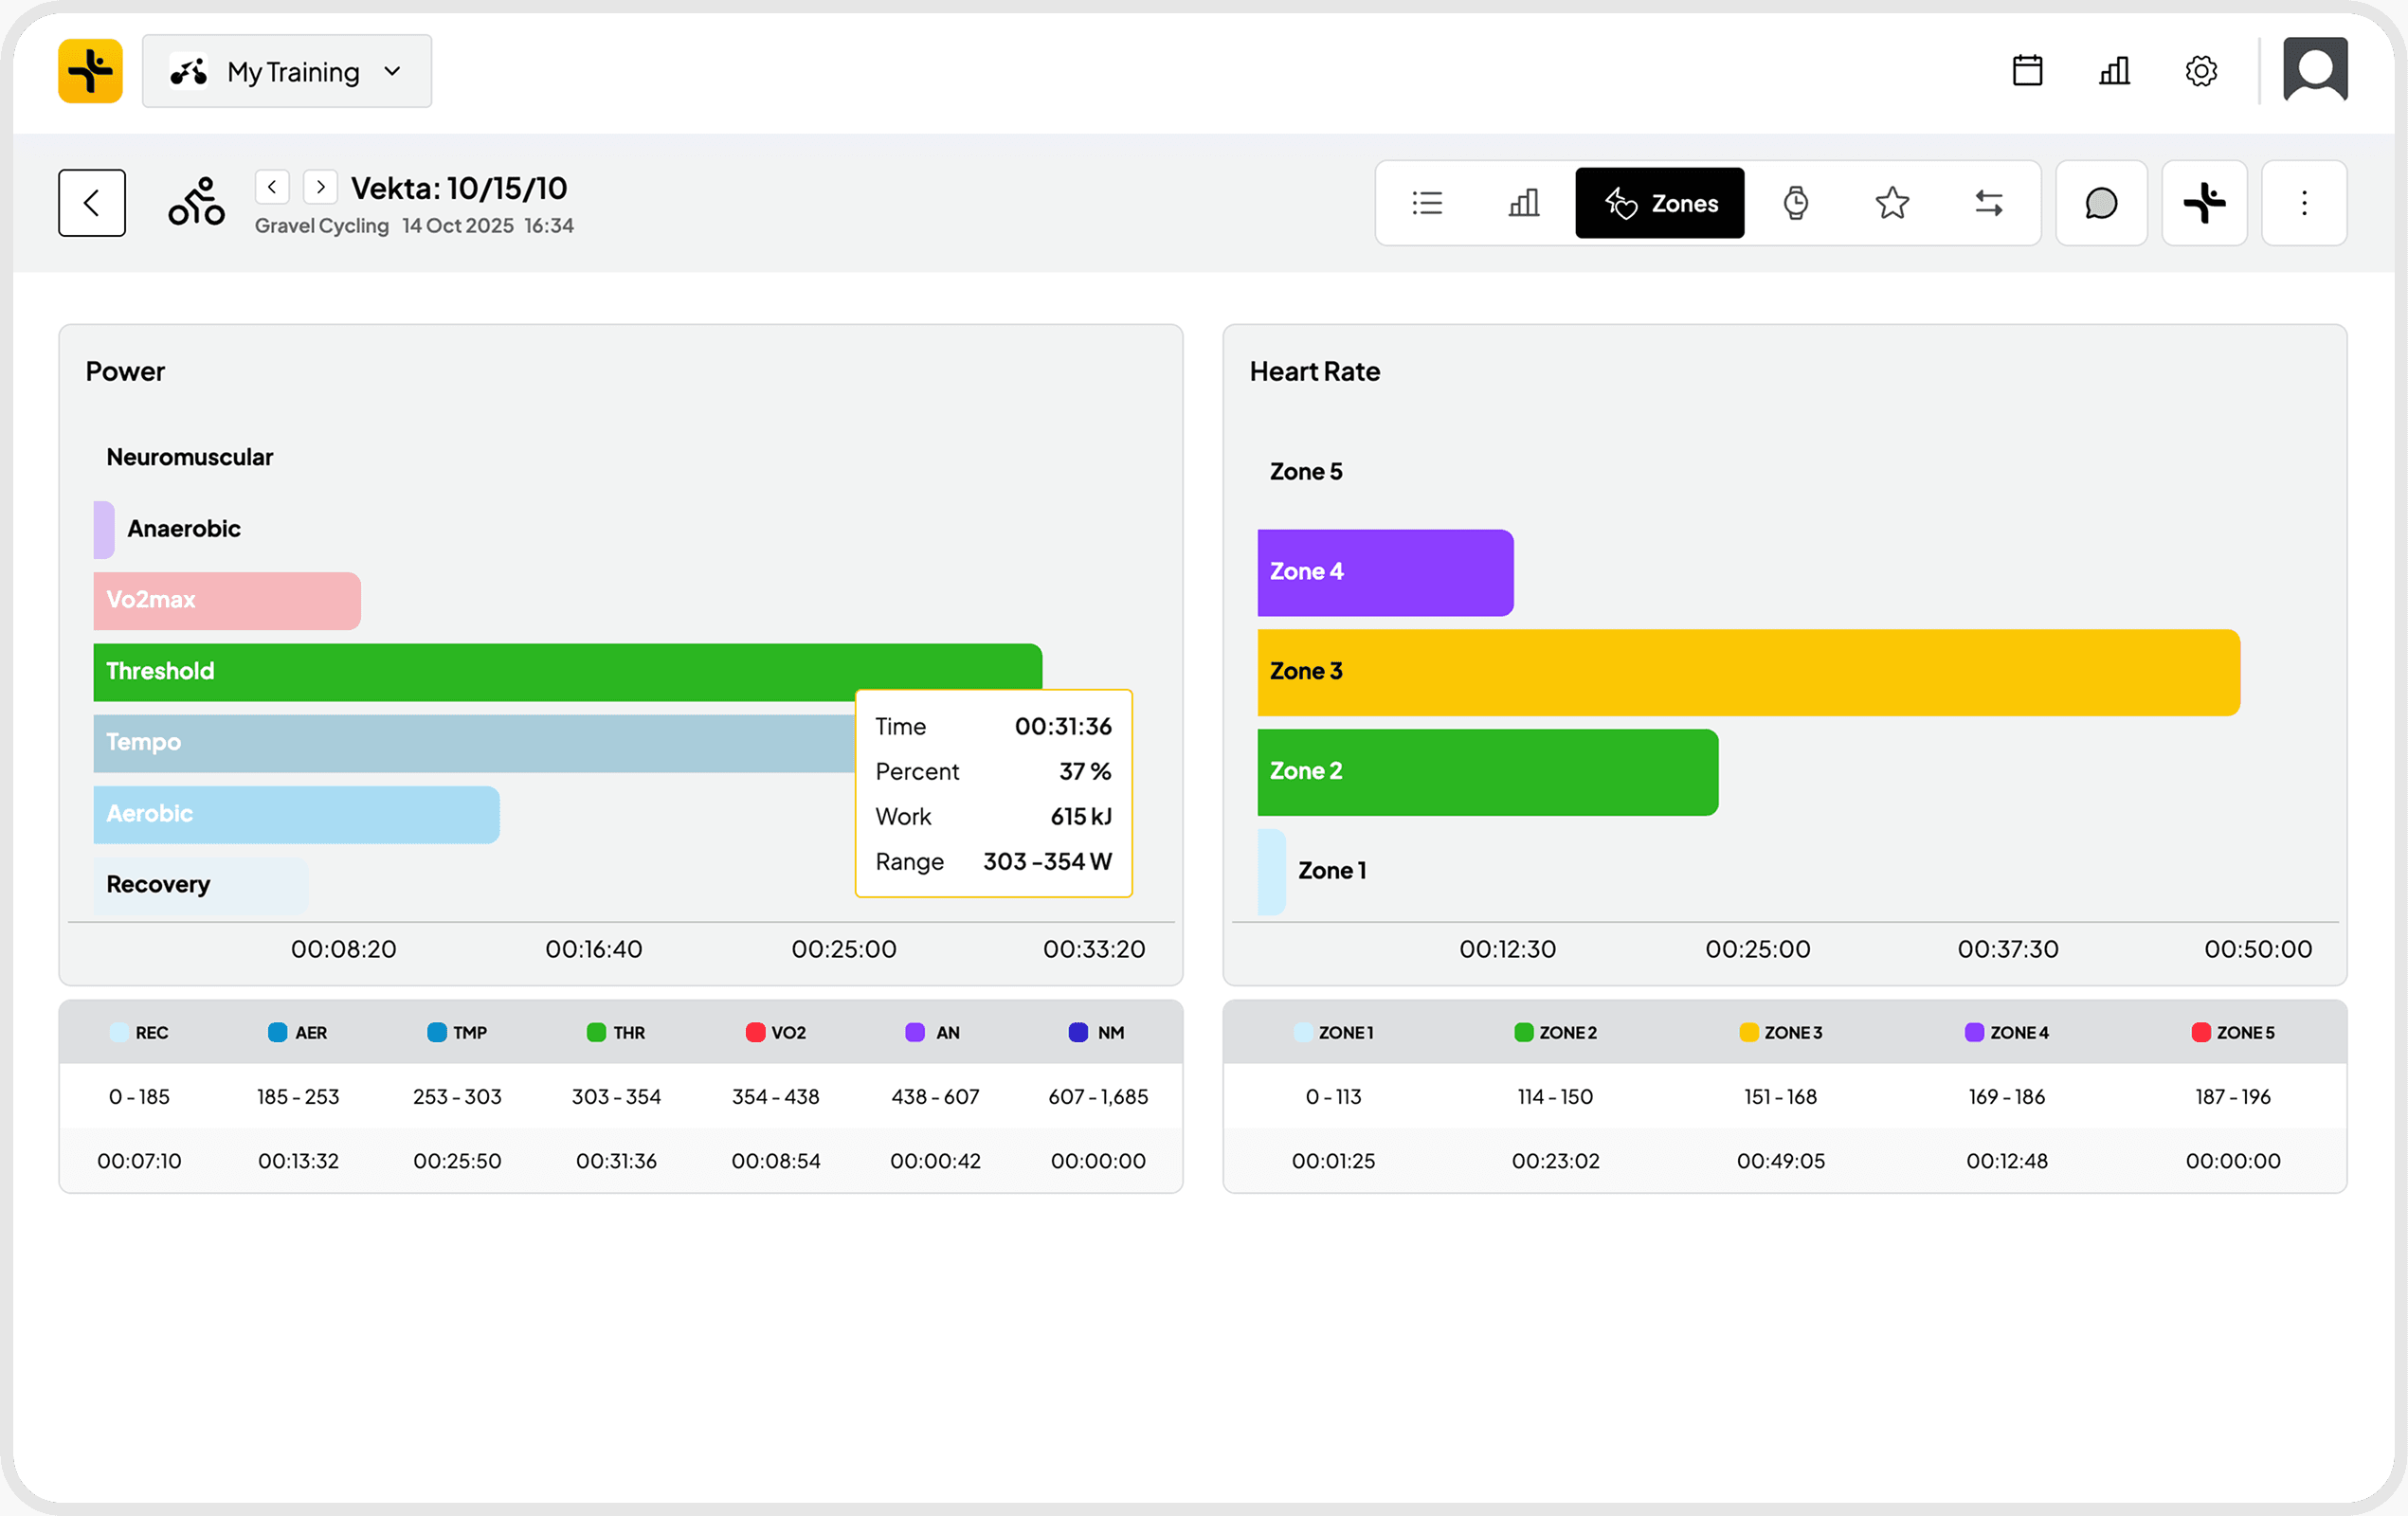
3. Time in Zone (TiZ) or Power Zone Distribution
• Definition: The distribution of time spent in different power or physiological zones (Z1–Z6).
• Relation to kJ: Two sessions with equal kJ can differ greatly in how that energy was distributed, one dominated by Zone 2, another by Zones 5–6.
• Value in Vekta: TiZ provides context on how Volume was accumulated across intensities and complements Vekta Intensity by showing where the physiological strain originated.
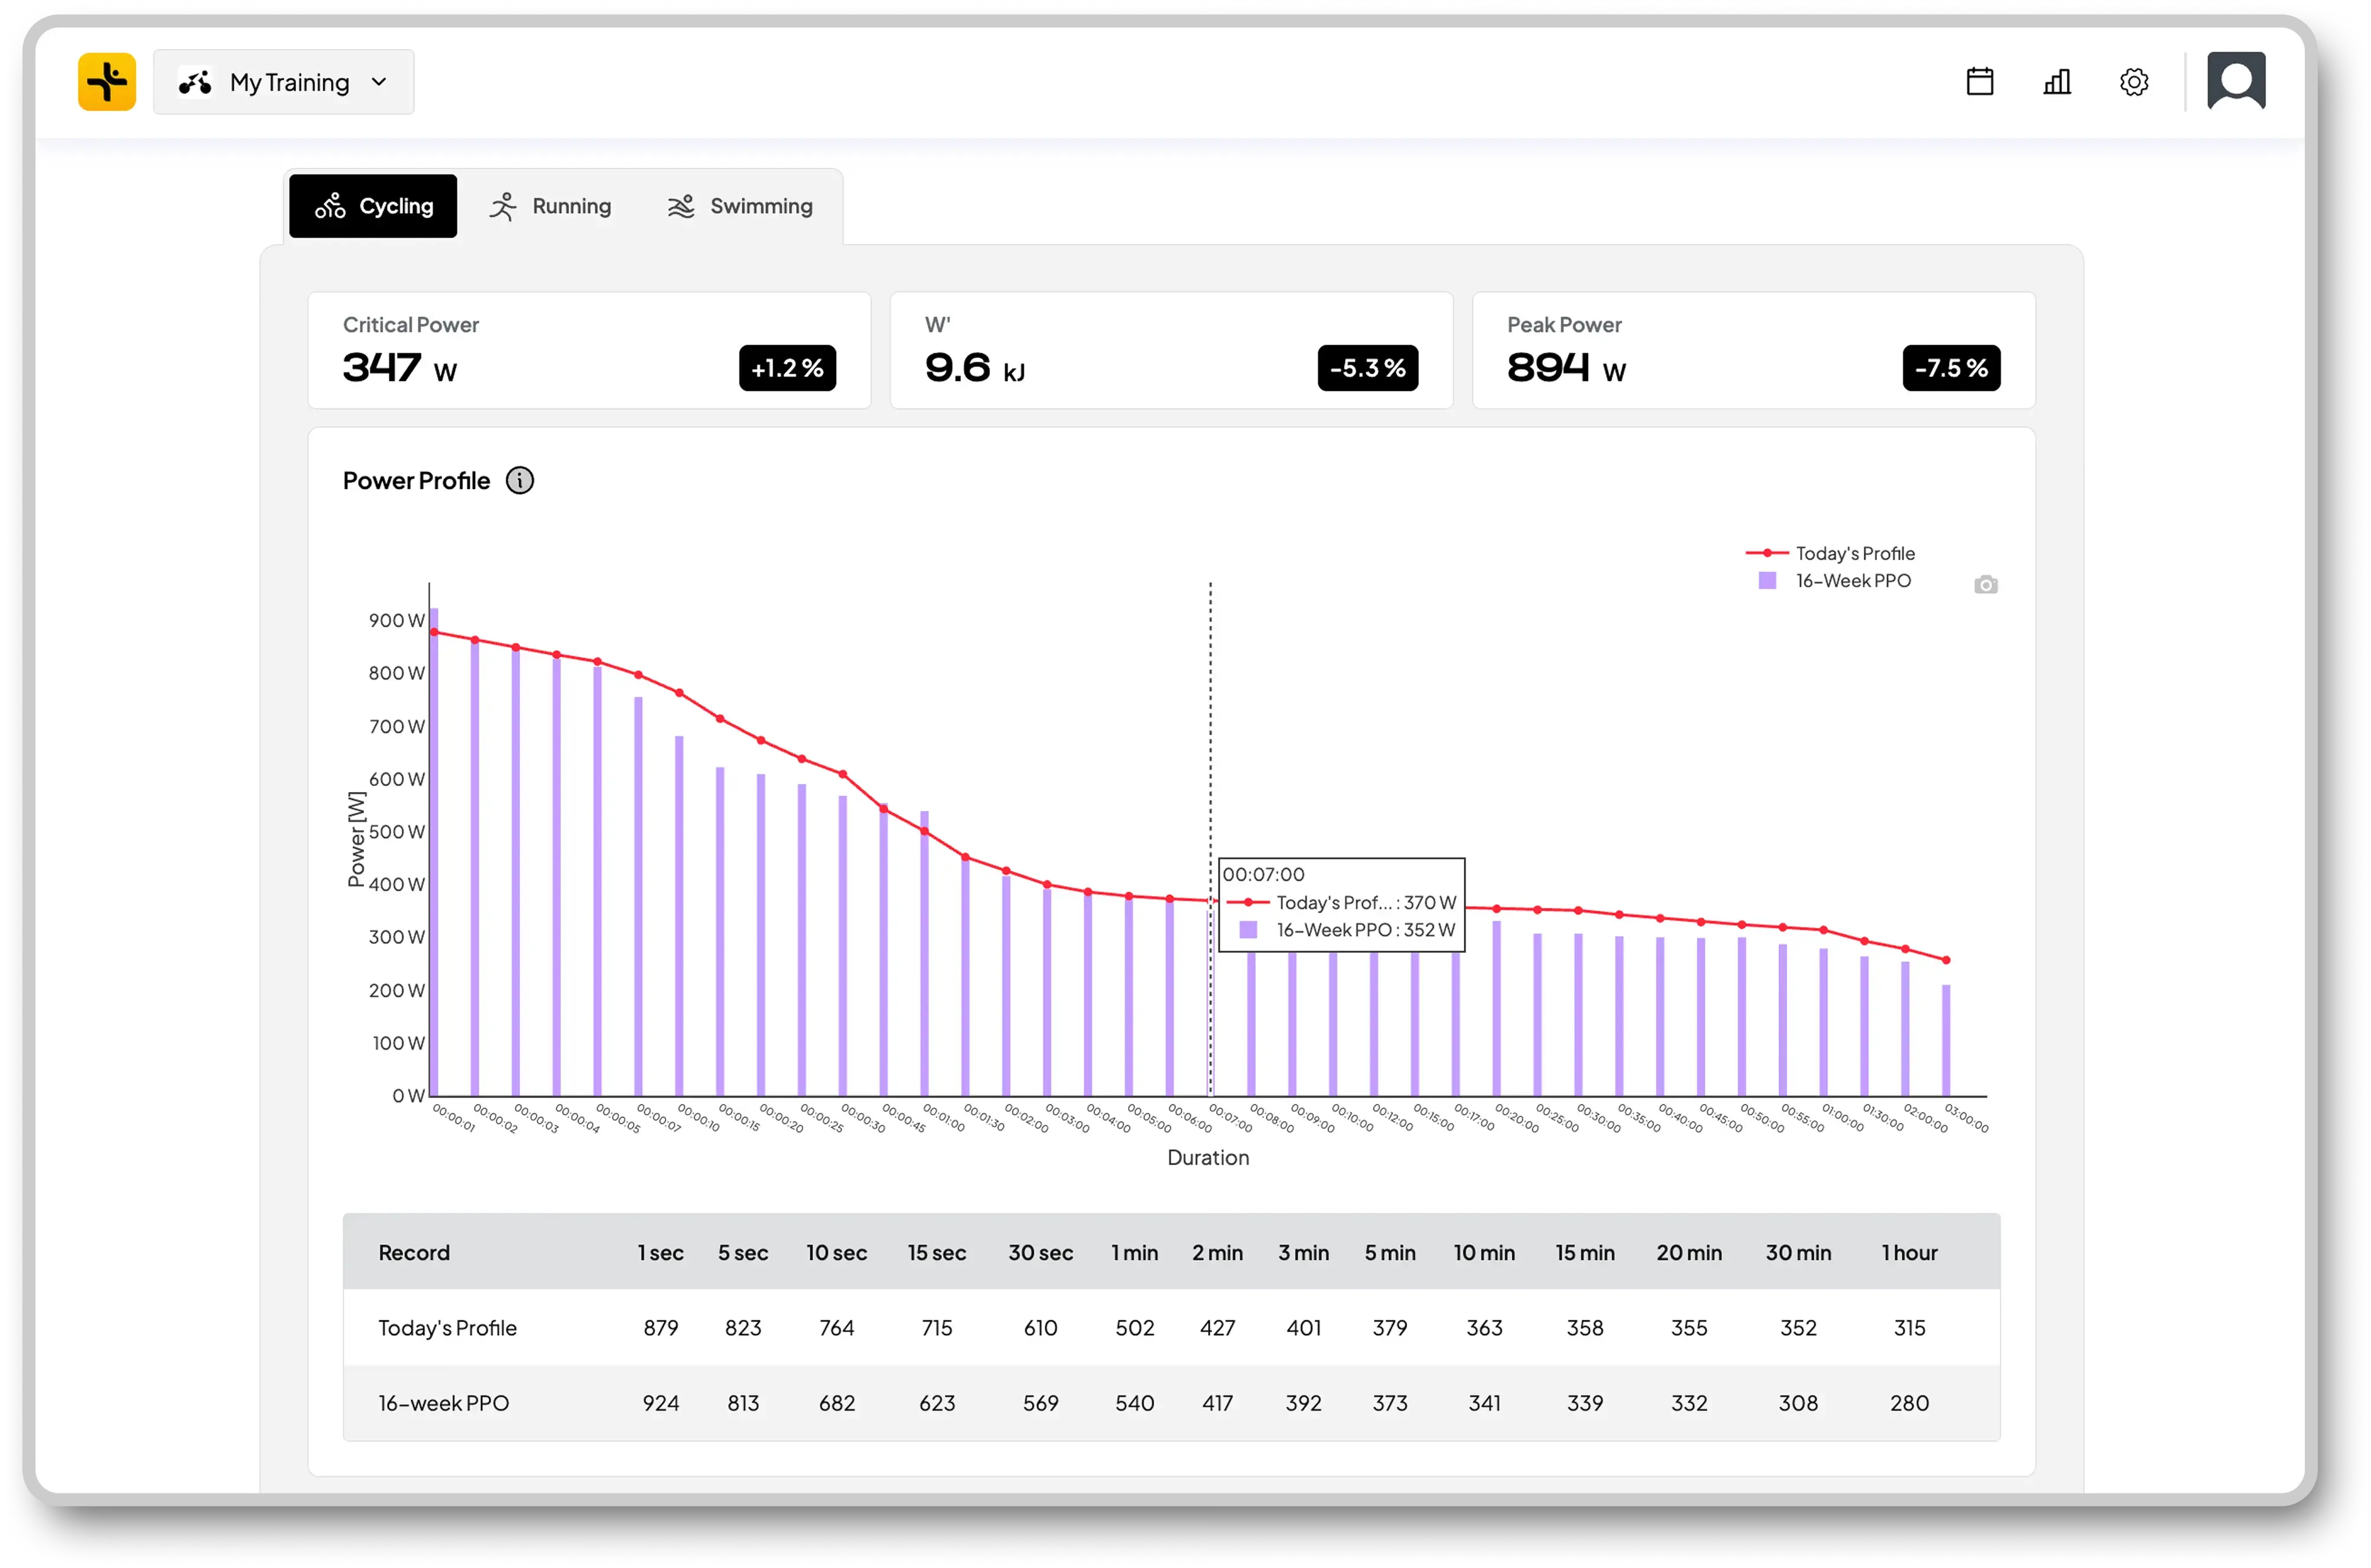
4. Critical Power (CP) and W′
These two measures remain central to Vekta’s internal modelling.
• CP defines the threshold separating predominantly aerobic from supra-threshold work.
• W′ represents the finite anaerobic energy reserve above CP.
Within Vekta Intensity, efforts above CP deplete W′, and repeated or prolonged supra-threshold efforts contribute more to Intensity than sub-CP work.
In summary:
• Below CP: kJ accumulation corresponds reasonably well to internal cost, with Volume being the dominant factor.
• Above CP: kJ becomes a weaker predictor of cost. Even small energy loads can generate high strain through W′ depletion.
Mixed sessions, such as race simulations, show why Intensity modelling is essential. W′ balance (W′bal) models more accurately capture fatigue dynamics during variable efforts.
Integrative Perspective: kJ, Vekta Volume & Intensity, and Internal Load
Low-intensity blocks: In these phases, kJ (Volume) often track closely with internal load. Intensity stays low and stable, so Volume is a reliable guide for cumulative training load.
Race preparation or sharpening: When sessions include more supra-threshold work, kJ begin to decouple from physiological cost. Intensity becomes the critical factor for interpreting stress and recovery.
Race demands or mixed profiles: These sessions combine both high Volume and high Intensity. Understanding them requires both dimensions. kJ alone cannot reveal the hardest efforts, while Intensity alone does not represent total work done.
By combining kJ-derived Volume with Vekta Intensity, and by cross-referencing internal metrics such as sRPE and TiZ, coaches and athletes can form a richer, multidimensional picture of session stress and recovery requirements.
Practical Implications for Professional Cycling
Load monitoring: Treat kJ as the Volume component within a broader model of training load, not as a standalone measure of stress. Use Vekta Intensity to capture the physiological cost that kJ alone cannot describe.
Periodisation:
• Base phases: Rely more on Volume (kJ) as the primary guide, since Intensity remains low.
• Build and taper phases: Shift the focus toward Intensity and targeted high-stress sessions, while managing how Volume is distributed across different intensities.
Recovery management: High-intensity sessions with modest kJ values can still produce significant recovery demands. Vekta Intensity helps reveal these hidden stresses.
Performance forecasting and readiness: Using both Volume and Intensity together provides a more accurate prediction of adaptation, fatigue, and performance than relying on kJ or any single score.
Vekta also assigns training stimulus tags such as VO₂max, Threshold, or Endurance, based on the session’s intensity, duration, and energy characteristics. This helps coaches and athletes identify which physiological systems were most stressed during a given session.
Future Directions
Hybrid load models: Combining external metrics such as kJ and power curves with internal signals like heart rate, HRV, biochemical markers, and sRPE can improve how training responses are modelled. Machine learning may help refine these relationships at an individual level.
Adaptive personalisation: Because Vekta Intensity is athlete-specific, scaling with factors such as CP, W′, Pmax, and environmental conditions, future developments may adjust how much additional weight supra-threshold work carries for each athlete.
Nonlinear dynamics: Future research could explore whether certain Intensity thresholds, for example “critical zones” of Intensity, create step-like changes in adaptation or overreach risk instead of following a smooth linear pattern.

Conclusion
Kilojoule expenditure remains a fundamental measure of external work in professional cycling, but its real value appears when interpreted through the combined lens of Vekta Volume and Vekta Intensity. Volume shows how much work was done, while Intensity reveals how demanding that work was from a physiological perspective.
At lower intensities, kJ and therefore Volume correlate reasonably well with internal stress, making them useful for tracking base load. As intensity increases, however, this relationship begins to separate. High Intensity amplifies strain far more than kJ alone suggests. In these cases, the Intensity axis, grounded in CP and W′ modelling, becomes essential for understanding the true cost of training.
For coaches and practitioners, the message is clear. Do not view kJ, or any single scalar score, as sufficient on its own. Combine kJ (Volume) with Intensity, time-in-zone data, and internal feedback such as sRPE and heart rate. This integrated view allows for smarter periodisation, more accurate recovery strategies, and a clearer understanding of athlete readiness, particularly in the complex demands of professional cycling.
Start your free 14-day trial or Book a Demo
In cycling, understanding the true cost of training goes beyond measuring the work performed. While kilojoules (kJ) remain a key indicator of external load, they don’t capture how intensity changes the physiological demand of a session.
In this piece, Fabien Rabeau, Head of Performance at ARKÉA B&B Hotels, examines how exercise intensity shapes the relationship between energy expenditure and internal load, and how Vekta’s Volume and Intensity framework offers a more complete view of training stress and adaptation. Vekta Volume and Intensity underpin how training load is interpreted within the platform.
Introduction
In professional cycling, accurately quantifying training load is essential for balancing stimulus and recovery. Traditionally, kilojoules (kJ), derived from power output, have offered a simple measure of external work. However, the true physiological and perceptual cost of a session is not determined by energy expenditure alone. Factors such as intensity, power distribution, and metabolic stress influence how demanding a session feels and how much strain it imposes internally.
With the advent of Vekta’s Volume & Intensity paradigm, we now have a more complete two-dimensional view of training: how much work was done (Volume) and how hard it was (Intensity). This article explores how exercise intensity shapes the relationship between kilojoules and internal load metrics, such as session RPE (sRPE) and time-in-zone, and what that means for understanding training stress in professional cycling.
Kilojoules as a Measure of External Load
Kilojoules (kJ) represent the mechanical energy a rider produces through power output. In long, steady sessions at moderate intensity, kJ scale almost linearly with duration, making them a practical indicator of total external work. However, kJ alone miss key aspects of training demand.
• Two sessions with identical kJ can create very different internal stress depending on whether they’re performed below or above threshold.
• kJ do not reflect neuromuscular fatigue, metabolic strain per minute, or the overall “hardness” of the effort.
As a result, kJ provide a dependable measure of total work done but remain an incomplete predictor of recovery needs or adaptive stimulus.
The Role of Intensity in Modulating kJ–Load Relationships
Intensity fundamentally shapes how kilojoules relate to the internal consequences of training.
• Low-Intensity, High-Volume (Zone 1–2): You can accumulate high kJ with relatively low internal strain. The cost per kJ is modest.
• Threshold or Supra-Threshold Work (Zones 3–6): Even moderate kJ expenditure in these zones can create a disproportionately high metabolic, neuromuscular, and perceptual load.
• High-Intensity Intervals: Sessions with modest kJ but concentrated high-intensity efforts often produce a high level of internal stress, showing how energy output and physiological cost can become uncoupled.
In Vekta’s framework, this uncoupling is exactly what the Intensity metric is designed to capture. It gives greater weight to efforts above Critical Power (CP) while remaining independent of session duration.
Comparative Training Load Metrics (Under a Vekta Lens)
In a Vekta-centric model, kilojoules (kJ) are not treated as the primary measure of training load but as one axis, Volume, within a two-dimensional system. Below is how traditional metrics compare and interact within that framework.
1. Vekta Volume and Intensity
• Vekta Volume quantifies total session demand, adjusted for rate of work and normalised by body weight.
• Vekta Intensity captures how hard a session was by continuously assessing local intensity and giving greater weight to efforts above Critical Power (CP). It also factors in W′, Pmax, fatigue accumulation, and environmental conditions such as altitude.
Together, these two metrics separate “how much” work was done from “how difficult” it was. This is similar to distinguishing distance from gradient.
A session with modest Volume but very high Intensity, for example short VO₂max intervals, differs meaningfully from a long, steady ride with low Intensity.
2. Session RPE (sRPE)
• Definition: The athlete’s subjective rating of session difficulty (e.g. 1–10), multiplied by duration.
• Relation to kJ: In steady, sub-threshold work, sRPE tends to correlate moderately with kJ and with Vekta Volume.
• Divergence under intensity: In high-stress conditions such as heat, altitude, or fatigue, sRPE can be elevated even when kJ are moderate. High-intensity efforts often increase sRPE, aligning more closely with Vekta Intensity.
sRPE remains a valuable internal feedback tool. Within the Vekta framework, it often correlates better with Intensity than with Volume, particularly in sessions that include significant supra-threshold work.
3. Time in Zone (TiZ) or Power Zone Distribution
• Definition: The distribution of time spent in different power or physiological zones (Z1–Z6).
• Relation to kJ: Two sessions with equal kJ can differ greatly in how that energy was distributed, one dominated by Zone 2, another by Zones 5–6.
• Value in Vekta: TiZ provides context on how Volume was accumulated across intensities and complements Vekta Intensity by showing where the physiological strain originated.
4. Critical Power (CP) and W′
These two measures remain central to Vekta’s internal modelling.
• CP defines the threshold separating predominantly aerobic from supra-threshold work.
• W′ represents the finite anaerobic energy reserve above CP.
Within Vekta Intensity, efforts above CP deplete W′, and repeated or prolonged supra-threshold efforts contribute more to Intensity than sub-CP work.
In summary:
• Below CP: kJ accumulation corresponds reasonably well to internal cost, with Volume being the dominant factor.
• Above CP: kJ becomes a weaker predictor of cost. Even small energy loads can generate high strain through W′ depletion.
Mixed sessions, such as race simulations, show why Intensity modelling is essential. W′ balance (W′bal) models more accurately capture fatigue dynamics during variable efforts.
Integrative Perspective: kJ, Vekta Volume & Intensity, and Internal Load
Low-intensity blocks: In these phases, kJ (Volume) often track closely with internal load. Intensity stays low and stable, so Volume is a reliable guide for cumulative training load.
Race preparation or sharpening: When sessions include more supra-threshold work, kJ begin to decouple from physiological cost. Intensity becomes the critical factor for interpreting stress and recovery.
Race demands or mixed profiles: These sessions combine both high Volume and high Intensity. Understanding them requires both dimensions. kJ alone cannot reveal the hardest efforts, while Intensity alone does not represent total work done.
By combining kJ-derived Volume with Vekta Intensity, and by cross-referencing internal metrics such as sRPE and TiZ, coaches and athletes can form a richer, multidimensional picture of session stress and recovery requirements.
Practical Implications for Professional Cycling
Load monitoring: Treat kJ as the Volume component within a broader model of training load, not as a standalone measure of stress. Use Vekta Intensity to capture the physiological cost that kJ alone cannot describe.
Periodisation:
• Base phases: Rely more on Volume (kJ) as the primary guide, since Intensity remains low.
• Build and taper phases: Shift the focus toward Intensity and targeted high-stress sessions, while managing how Volume is distributed across different intensities.
Recovery management: High-intensity sessions with modest kJ values can still produce significant recovery demands. Vekta Intensity helps reveal these hidden stresses.
Performance forecasting and readiness: Using both Volume and Intensity together provides a more accurate prediction of adaptation, fatigue, and performance than relying on kJ or any single score.
Vekta also assigns training stimulus tags such as VO₂max, Threshold, or Endurance, based on the session’s intensity, duration, and energy characteristics. This helps coaches and athletes identify which physiological systems were most stressed during a given session.
Future Directions
Hybrid load models: Combining external metrics such as kJ and power curves with internal signals like heart rate, HRV, biochemical markers, and sRPE can improve how training responses are modelled. Machine learning may help refine these relationships at an individual level.
Adaptive personalisation: Because Vekta Intensity is athlete-specific, scaling with factors such as CP, W′, Pmax, and environmental conditions, future developments may adjust how much additional weight supra-threshold work carries for each athlete.
Nonlinear dynamics: Future research could explore whether certain Intensity thresholds, for example “critical zones” of Intensity, create step-like changes in adaptation or overreach risk instead of following a smooth linear pattern.
Conclusion
Kilojoule expenditure remains a fundamental measure of external work in professional cycling, but its real value appears when interpreted through the combined lens of Vekta Volume and Vekta Intensity. Volume shows how much work was done, while Intensity reveals how demanding that work was from a physiological perspective.
At lower intensities, kJ and therefore Volume correlate reasonably well with internal stress, making them useful for tracking base load. As intensity increases, however, this relationship begins to separate. High Intensity amplifies strain far more than kJ alone suggests. In these cases, the Intensity axis, grounded in CP and W′ modelling, becomes essential for understanding the true cost of training.
For coaches and practitioners, the message is clear. Do not view kJ, or any single scalar score, as sufficient on its own. Combine kJ (Volume) with Intensity, time-in-zone data, and internal feedback such as sRPE and heart rate. This integrated view allows for smarter periodisation, more accurate recovery strategies, and a clearer understanding of athlete readiness, particularly in the complex demands of professional cycling.
Start your free 14-day trial or Book a Demo
Frequently asked questions

Head of Performance | ARKEA-B&B HOTELS
Critical Power and W′ Explained: Insights from Alex Welburn


W Prime - Your Battery Above Critical Power

Dream big with Vekta, the most advanced training and coaching platform.

Ce projet a été financé par la Région et/ou par l’État dans le cadre de France 2030
© 2026 — Copyright - GRAIG SAS
Dream big with Vekta, the most advanced training and coaching platform.
Ce projet a été financé par la Région et/ou par l’État dans le cadre de France 2030
© 2026 — Copyright - GRAIG SAS